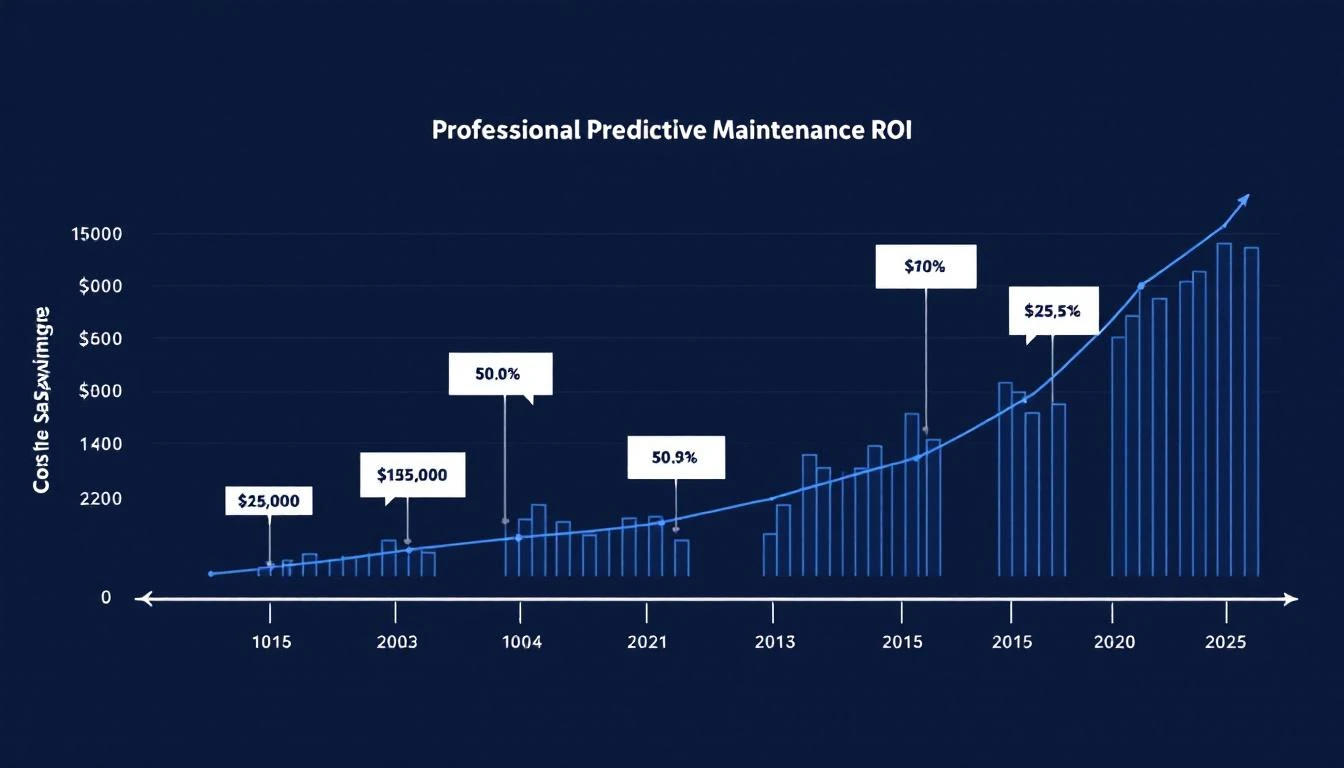
Predictive Maintenance ROI Calculator: How to Build a Business Case Your CFO Will Approve
Every maintenance manager knows predictive maintenance works. The evidence is overwhelming — decades of industry data showing 25-30% cost reductions, 70-75% fewer breakdowns, and 10-20% equipment life extension. The U.S. Department of Energy puts predictive maintenance costs at $4-8 per horsepower annually versus $15-18 for reactive maintenance.
So why do most predictive maintenance proposals die in the CFO's office?
Because maintenance managers present technology features. CFOs want financial returns. The gap between "this platform monitors vibration signatures using machine learning" and "this investment returns $847,000 in avoided costs over 36 months with a 14-month payback period" is the gap between a rejected proposal and an approved purchase order.
This guide provides the formulas, benchmarks, and framework to build a predictive maintenance business case that speaks the CFO's language.
The Three Cost Categories That Drive PdM ROI
Predictive maintenance ROI comes from three sources. Most business cases only capture one (maintenance cost reduction) and miss the two that are actually larger:
1. Avoided Unplanned Downtime (60-70% of ROI)
This is the elephant in the room. Unplanned downtime costs $10,000-$250,000+ per hour in manufacturing, depending on the industry. Aberdeen Group research puts the average for discrete manufacturing at $260,000 per hour. Even at the conservative end — $10,000/hour — the math is dramatic.
Formula:
Annual Unplanned Downtime Cost =
  (Hours of unplanned downtime per year) ×
  (Cost per hour of downtime)
How to calculate cost per hour of downtime:
Hourly Downtime Cost =
  Lost production value +
  Idle labor cost +
  Emergency repair premium +
  Material waste/spoilage +
  Customer penalties (late delivery) +
  Expedited shipping costs
Industry benchmarks for unplanned downtime hours per year:
- Automotive: 40-80 hours
- Food & Beverage: 60-120 hours
- General discrete manufacturing: 50-100 hours
- Process manufacturing: 30-60 hours
Conservative PdM impact: Predictive maintenance typically reduces unplanned downtime by 35-50% in the first year, reaching 70-90% by year three as the system builds baseline data and operators learn to respond to early warnings.
Example calculation:
- Current unplanned downtime: 80 hours/year
- Cost per hour: $15,000
- Annual downtime cost: $1,200,000
- Year 1 PdM reduction: 40% = $480,000 saved
- Year 3 PdM reduction: 75% = $900,000 saved
2. Maintenance Cost Optimization (20-25% of ROI)
Predictive maintenance doesn't just reduce reactive repair costs — it also eliminates unnecessary preventive maintenance. Both directions save money:
Reactive maintenance avoided:
Reactive Repair Cost =
  Emergency labor premium (1.5-3x normal rates) +
  Express parts shipping +
  Collateral damage from catastrophic failures +
  Overtime for catch-up production
Industry data consistently shows reactive repairs cost 3-10x more than the same repair performed on a planned basis. An emergency bearing replacement at 2 AM on a Saturday costs 5-7x what a planned replacement during scheduled maintenance costs.
Unnecessary preventive maintenance eliminated:
Over-Maintenance Cost =
  (Components replaced before end of useful life) ×
  (Cost per component) +
  (Planned maintenance hours for unnecessary PMs) ×
  (Labor cost per hour)
Most PM programs replace components at 60-70% of their actual useful life — a 30-40% waste in parts and labor. Condition-based monitoring extends replacement intervals to match actual component condition, not conservative calendar schedules.
Industry benchmarks:
- Reactive maintenance: $15-18/HP/year
- Preventive maintenance: $9-12/HP/year
- Predictive maintenance: $4-8/HP/year
Example calculation (100 machines, 50 HP average):
- Current PM cost: 5,000 HP × $11/HP = $55,000/year
- PdM cost: 5,000 HP × $6/HP = $30,000/year
- Annual maintenance savings: $25,000
- Plus reactive repair avoidance: $50,000-$100,000/year
3. Extended Equipment Life and Energy Savings (10-15% of ROI)
Equipment life extension: Operating equipment within optimal parameters — catching alignment issues, lubricant degradation, and thermal anomalies early — extends equipment life by 10-20%. For a manufacturer with $5M in critical equipment, a 15% life extension represents $750,000 in deferred capital expenditure.
Energy savings: Poorly maintained equipment consumes more energy. A misaligned motor draws 2-15% more current. A fouled heat exchanger requires more energy to achieve the same thermal transfer. An air compressor with worn seals runs longer to maintain pressure.
Real-time monitoring catches energy anomalies that are often the earliest indicators of equipment degradation. Fixing them saves energy AND prevents the failure:
Energy Savings =
  (Number of machines with energy anomalies detected) ×
  (Average excess energy consumption per anomaly) ×
  (Hours of operation per year) ×
  (Energy cost per kWh)
Benchmark: 5-15% energy reduction on monitored equipment is typical.
Building the Business Case: Step by Step
Step 1: Document Current State
Before you can project savings, you need to know what you're spending now. Pull these numbers from your maintenance and finance systems:
| Metric | Where to Find It | Why It Matters |
|---|---|---|
| Annual unplanned downtime hours | Production reports, CMMS | Largest ROI driver |
| Cost per hour of downtime | Finance/operations | Converts downtime hours to dollars |
| Annual maintenance spend | Cost center reports | Baseline for cost reduction |
| Maintenance labor breakdown (reactive/preventive/predictive %) | CMMS work order analysis | Shows opportunity for shift from reactive |
| Emergency repair frequency | CMMS, purchasing | Quantifies reactive maintenance premium |
| Spare parts expedite costs | Purchasing records | Often overlooked cost of reactive maintenance |
| Equipment replacement schedule | Capital planning | Baseline for life extension savings |
| Energy consumption by area | Utility bills, sub-metering | Baseline for energy savings |
Step 2: Project Conservative Savings
Use the conservative end of industry benchmarks. CFOs discount aggressive projections, and conservative estimates that are exceeded build more credibility than aggressive estimates that are missed.
Conservative first-year impact assumptions:
- Unplanned downtime reduction: 30% (industry average: 35-50%)
- Maintenance cost reduction: 15% (industry average: 20-30%)
- Energy savings: 5% (industry average: 5-15%)
- Equipment life extension: Not included in Year 1 (too conservative for CFO comfort)
Step 3: Calculate Total Investment
Include ALL costs — CFOs will ask about everything you leave out:
Year 1 Total Investment =
  Platform subscription (annual) +
  Edge device hardware +
  Installation labor (internal or external) +
  Training time (maintenance team) +
  IT/OT coordination time (if applicable) +
  Contingency (10% of above)
For IIoT platforms like MachineCDN that deploy in minutes via cellular with no IT involvement, several of these line items shrink dramatically or disappear entirely:
- Installation labor: minimal (3 minutes per machine by existing maintenance tech)
- IT/OT coordination: zero (cellular bypasses plant network)
- Training: minimal (intuitive dashboard, configurable alerts)
Step 4: Calculate Key Financial Metrics
CFOs evaluate investments using standard financial metrics. Present all three:
Payback Period:
Payback Period (months) =
  Total Year 1 Investment ÷
  (Annual Savings ÷ 12)
Target: Under 12 months. Under 6 months is compelling.
ROI (Return on Investment):
3-Year ROI =
  ((Total 3-Year Savings - Total 3-Year Cost) ÷ Total 3-Year Cost) × 100
Target: 200%+ over 3 years.
NPV (Net Present Value):
NPV = Σ (Annual Net Savings ÷ (1 + discount rate)^year) - Initial Investment
Use your company's WACC or hurdle rate (typically 10-15% for manufacturing).
Step 5: Build the One-Page Summary
The full business case might be 10 pages. The CFO will read one. Make it count:
Example one-page summary:
Predictive Maintenance Business Case — Plant A (50 CNC machines)
| Category | Current Annual Cost | With PdM | Annual Savings |
|---|---|---|---|
| Unplanned downtime (60 hrs × $15K) | $900,000 | $630,000 | $270,000 |
| Maintenance (reactive → predictive) | $165,000 | $140,000 | $25,000 |
| Energy (5% reduction on monitored equipment) | $240,000 | $228,000 | $12,000 |
| Total Annual Savings | $307,000 |
| Investment | Amount |
|---|---|
| Year 1 total (platform + hardware + setup) | $85,000 |
| Annual recurring (years 2+) | $60,000 |
| Financial Metrics | |
|---|---|
| Payback period | 3.3 months |
| Year 1 ROI | 261% |
| 3-Year NPV (10% discount rate) | $541,000 |
| 3-Year ROI | 398% |
Common CFO Objections and How to Address Them
"These savings projections seem aggressive."
Use the conservative assumptions outlined above and cite U.S. Department of Energy data, which puts predictive maintenance at $4-8/HP vs $15-18/HP for reactive. Also offer to run a 90-day pilot on 10 machines to validate projections with your own data before full deployment.
"We already have a CMMS."
CMMS manages maintenance activities. IIoT provides the real-time machine intelligence that tells you what maintenance is actually needed. They're complementary. The CMMS tells you what maintenance was scheduled. The IIoT platform tells you what maintenance is actually necessary. Together, they eliminate both unplanned failures (IIoT catches them) and unnecessary PMs (IIoT validates that components are still healthy).
"What's the risk if it doesn't work?"
With platforms like MachineCDN that deploy in minutes with no infrastructure changes, the risk is essentially the subscription cost for the pilot period. No servers purchased. No network changes made. No construction or wiring. If the pilot doesn't deliver measurable results, you cancel the subscription and unplug the devices. Compare that to a $200K SCADA project that takes 12 months and requires infrastructure investment before any value is delivered.
"Can't we just improve our preventive maintenance program?"
You can, and you should. But even a perfect PM program still replaces components at 60-70% of useful life (conservative schedules), still misses failure modes that aren't time-correlated (contamination, process upsets, operator error), and still can't tell you which specific machine needs attention right now. Predictive maintenance addresses the 20-30% of costs that even the best PM program can't.
"How long until we see results?"
This is where platform choice matters enormously. Enterprise IIoT platforms with 6-12 month deployments delay ROI by 6-12 months. Platforms like MachineCDN that deploy in minutes deliver data on day one, actionable alerts within the first week, and measurable downtime reduction within 30-60 days. MachineCDN customers typically achieve full ROI within five weeks.
The Pilot Approach: Reducing Risk
The most effective strategy for getting CFO approval is proposing a bounded pilot rather than a full deployment:
- Select 10 critical machines — highest downtime cost, most maintenance-intensive
- Deploy IIoT monitoring — with MachineCDN, this takes 30 minutes total
- Run for 90 days — collect baseline data, configure alerts, track interventions
- Document results — actual downtime avoided, anomalies detected, maintenance optimized
- Build the full business case — using your own data, not industry benchmarks
The pilot investment is minimal. The data is irrefutable because it comes from your own machines. And the CFO gets evidence-based projections instead of vendor promises.
Conclusion
The ROI of predictive maintenance isn't theoretical — it's one of the most well-documented returns in manufacturing technology. The challenge isn't proving the math works. The challenge is presenting it in the language your CFO uses to evaluate investments: payback period, ROI, NPV, and risk.
The framework in this guide gives you everything you need to build that business case. The key is starting with your actual numbers — your downtime hours, your maintenance costs, your hourly production value — and applying conservative industry benchmarks that hold up under scrutiny.
For manufacturers ready to move from theory to pilot, MachineCDN makes it possible to start collecting the data you need to build your business case in under an hour. Three minutes per machine, five weeks to ROI, zero IT involvement.
Ready to build your business case with real data? Book a demo and start your pilot this week.