Multi-Plant Manufacturing Monitoring: How to Get Real-Time Visibility Across Every Location
You have four plants. Three states. Two countries. 200 machines total. And your Monday morning report is a spreadsheet cobbled together from four different plant managers who each use slightly different metrics, slightly different definitions of "downtime," and slightly different opinions about what counts as an alarm.
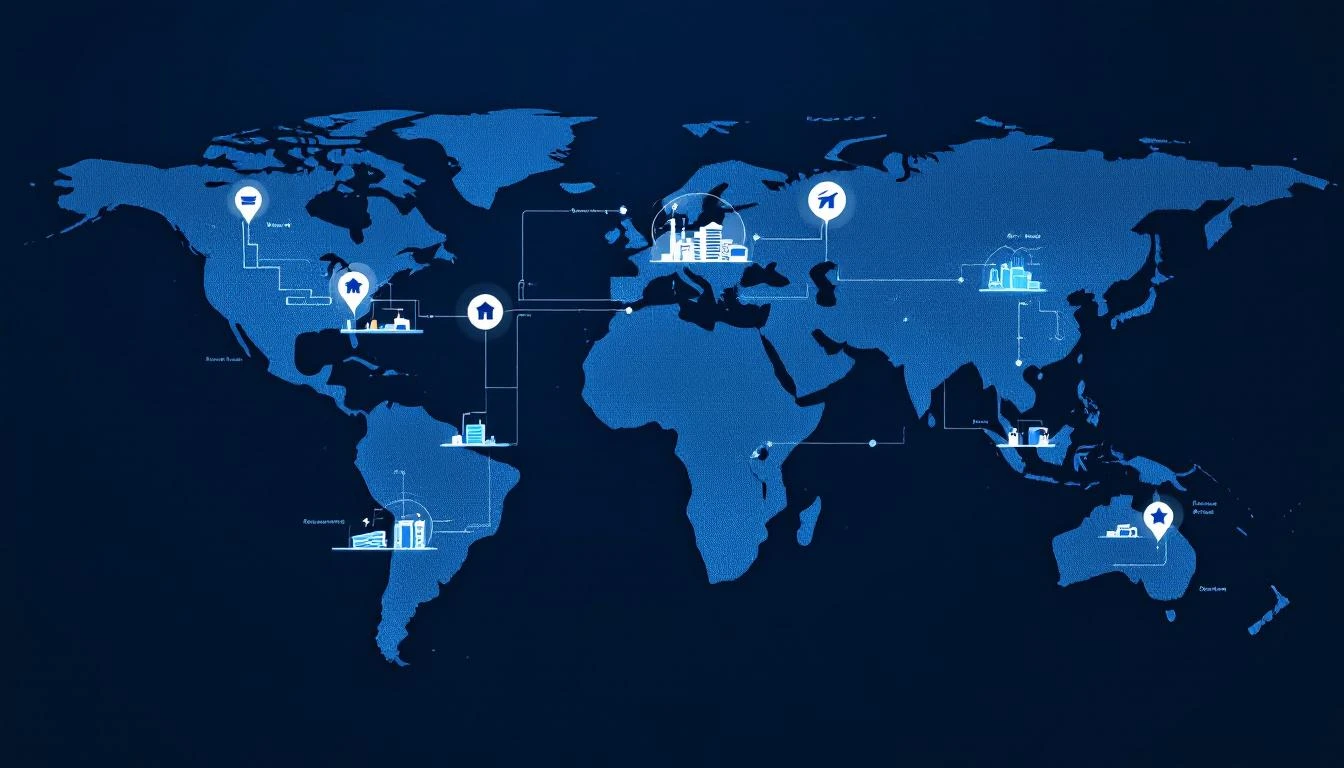
This is the multi-plant visibility problem, and it's universal in manufacturing organizations that have grown through acquisition, geographic expansion, or capacity scaling. Each plant has its own SCADA system, its own HMI panels, its own maintenance practices, and its own way of reporting performance. Getting a unified view of your manufacturing operation feels like translating between four different languages — because it is.
Modern IIoT platforms solve this by creating a single data model across all locations — but only if the platform was designed for fleet management from the ground up.
Why Traditional Approaches to Multi-Plant Visibility Fail
Before IIoT, manufacturers tried several approaches to multi-plant monitoring. All of them have fundamental limitations:
The Spreadsheet Approach
Each plant emails a daily or weekly production report. Someone at HQ consolidates the numbers into a master spreadsheet. Problems: data is stale by the time it's consolidated, metrics aren't standardized (Plant A calculates OEE differently from Plant B), and there's no drill-down capability. You know Plant C had 94% availability last week, but you can't see which machines or which shifts drove the number.
The ERP Approach
SAP, Oracle, or similar ERP systems aggregate production data from all plants. Problems: ERP data is transactional (order completions, material receipts) not operational (real-time machine states). You know Plant B produced 50,000 units last month, but you don't know that Machine 12 was running at 85% capacity while Machine 13 was down for 6 hours every Tuesday. And ERP data latency is typically hours to days.
The SCADA Bridge Approach
Some organizations attempt to connect plant-level SCADA systems to a central historian or supervisory system. Problems: SCADA systems from different vendors don't speak the same language. Connecting a Rockwell FactoryTalk system in Plant A to a Siemens WinCC system in Plant B requires custom integration, ongoing maintenance, and usually a systems integrator billing $200/hour. And this approach still doesn't standardize the data model — you're just aggregating incompatible data in one place.
The BI Dashboard Approach
Power BI, Tableau, or similar tools pull data from multiple sources and create visualizations. Problems: dashboards are only as good as their data sources. If the underlying data is inconsistent, delayed, or incomplete, the dashboard is a polished version of bad data. And BI tools have no understanding of manufacturing context — they can chart numbers but can't distinguish between a planned changeover and an unplanned breakdown.
What Fleet-Level IIoT Monitoring Actually Looks Like
A purpose-built IIoT platform for multi-plant manufacturing creates a unified data architecture:
Hierarchy: Company → Location → Zone → Machine
The fundamental organizing principle is a hierarchical structure that mirrors how manufacturing organizations actually work:
- Company — The enterprise level. One view of everything.
- Locations — Individual plants, facilities, or buildings. Each location can have its own address, timezone, and operational calendar.
- Zones — Areas within a location. A plant might have zones for machining, assembly, packaging, and shipping. Zones allow you to compare performance within a plant.
- Machines — Individual pieces of equipment within each zone.
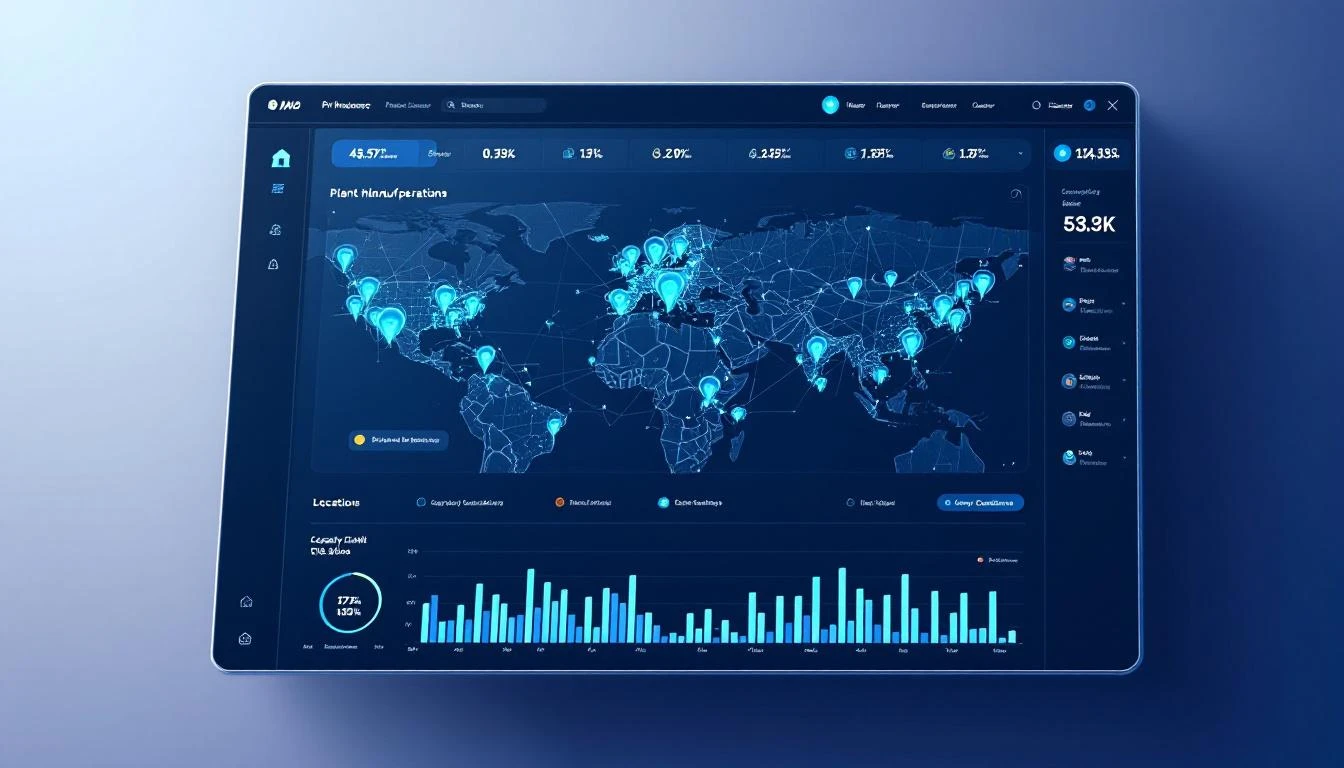
MachineCDN implements this full hierarchy with dashboard views at each level. The company dashboard shows all locations. Click a location to see its zones. Click a zone to see its machines. Click a machine to see its real-time data, alarms, and history. Three clicks from enterprise overview to machine detail.
Standardized Metrics Across All Locations
The real power of fleet-level monitoring isn't having all the data in one place — it's having all the data in the same format. When every location reports machine status, alarms, downtime, and performance metrics using the same data model, you can finally make valid comparisons:
-
Capacity utilization — What percentage of available production capacity is each location actually using? MachineCDN's fleet capacity utilization view shows this across all plants on one screen, with date-range filtering so you can compare periods.
-
Equipment availability — The availability component of OEE, standardized across locations. MachineCDN provides an equipment availability overview that spans the fleet, so you can see which locations and which machine types have the lowest availability — and whether the cause is maintenance issues, changeover time, or material stoppages.
-
Alarm rates — How many alarms per machine per hour at each location? A plant with twice the alarm rate of sister plants either has worse equipment or poorly configured alarm thresholds. Either way, you need to investigate.
-
Downtime patterns — What are the top downtime reasons at each location? If Plant A's #1 downtime driver is hydraulic failures and Plant B's is electrical faults, each plant needs a different reliability improvement focus.
Fleet Performance Analytics
Beyond real-time monitoring, fleet management requires analytical capabilities that reveal performance patterns across the operation:
Cross-plant benchmarking: If you have the same machine model in three locations, fleet analytics should show you which location gets the best performance from that machine type — and help you investigate why. Is it the maintenance program? The operating practices? The environmental conditions? MachineCDN's fleet performance view enables exactly this comparison.
Failure analysis across the fleet: When Machine Type A fails in Plant 1, is the same failure mode appearing in Plants 2 and 3? Fleet-wide failure analysis catches systemic issues — bad batches of spare parts, design weaknesses in specific machine models, or procedural gaps that exist across all locations. MachineCDN's fleet failure analysis dashboard aggregates spare parts consumption, failure types, and machine type performance across the entire operation.
Part management at scale: Which spare parts are you consuming fastest across all locations? Are you maintaining adequate inventory at each plant, or should you consolidate spare parts at a central warehouse? MachineCDN's fleet part management view provides this visibility — tracking parts availability and consumption patterns across the fleet.
The Cellular Connectivity Advantage for Multi-Plant Deployments
Here's where multi-plant IIoT deployments get practically challenging: networking.
If you're deploying an IIoT platform that runs on the plant network, you need IT involvement at every location. Different plants often have different IT teams, different network architectures, different firewall policies, and different timelines for approving new devices on their network. Getting IT approval at four plants simultaneously can take months.
MachineCDN eliminates this bottleneck entirely with cellular-connected edge gateways. The gateway has its own SIM card and communicates directly with the cloud — no plant network access required. This means:
- Deploy at any plant without IT involvement. The maintenance team can install and configure the gateway independently.
- Consistent connectivity model across all locations. No need to navigate different network architectures at each plant.
- No VPN or firewall configuration. Cellular connectivity bypasses all plant network infrastructure.
- Rapid rollout. A fleet deployment across four plants can happen in days, not months, because there are no IT dependencies.
For organizations with plants in different countries, this is even more valuable. International IT coordination — dealing with different compliance regimes, network standards, and approval processes — is a major bottleneck for multi-site IIoT deployments. Cellular connectivity makes the gateway self-contained and location-independent.
Real-World Multi-Plant Deployment Scenario
Consider a manufacturer with 3 plants:
- Plant A (Ohio): 60 machines, Rockwell PLCs, established maintenance program
- Plant B (Georgia): 45 machines, Siemens PLCs, newer facility
- Plant C (Mexico): 35 machines, mixed PLC brands, growing operation
Traditional approach timeline:
- Months 1-3: IT assessment and network planning at each plant
- Months 3-6: Network infrastructure changes and firewall configurations
- Months 6-9: SCADA integration project at each plant (different integrators for different PLC brands)
- Months 9-12: Data model standardization and central dashboard development
- Month 12+: First unified view of all three plants
- Total time to multi-plant visibility: 12+ months
MachineCDN approach timeline:
- Week 1: Deploy cellular edge gateways at Plant A (Rockwell PLCs connected via industrial protocol)
- Week 2: Deploy gateways at Plant B (Siemens PLCs connected via industrial protocol)
- Week 3: Deploy gateways at Plant C (mixed PLCs connected)
- Week 4: Configure unified hierarchy, standardized alarm thresholds, and fleet dashboards
- Total time to multi-plant visibility: 4 weeks
The difference is dramatic — and it's not because the technology is fundamentally different. It's because MachineCDN's architecture (protocol-native PLC connectivity + cellular gateways + cloud platform) eliminates the three biggest deployment bottlenecks: IT network access, PLC brand-specific integration, and data model standardization.
What to Look for in Multi-Plant IIoT Software
If multi-plant visibility is a priority, evaluate IIoT platforms against these criteria:
- Hierarchical data model — Company/Location/Zone/Machine structure with dashboards at each level
- Multi-PLC protocol support — Works with all major PLC brands without brand-specific integrators
- Fleet analytics — Cross-plant benchmarking, failure analysis, and capacity utilization views
- Standardized metrics — Same OEE calculation, same downtime categorization, same alarm thresholds across locations
- Network-independent connectivity — Cellular or other connectivity that doesn't require plant IT involvement
- User role management — Plant managers see their plant, regional managers see their region, VP of Manufacturing sees everything
- Timezone support — Sounds trivial, but when Plant A is Eastern and Plant C is Central, time-based analytics need to handle this correctly
MachineCDN checks every box. Most traditional SCADA-extension approaches fail at #2, #5, and #6. Most standalone IoT platforms fail at #1 and #3 because they were built for single-site deployments and bolted on multi-site later.
The Strategic Value of Fleet Visibility
Multi-plant monitoring isn't just an operational tool — it's a strategic capability that enables:
- Capital allocation decisions — Which plant needs new equipment? Fleet data shows you which machines and locations are underperforming and why.
- Best practice transfer — When one plant outperforms others, fleet data helps you identify specifically what they're doing differently so you can replicate it.
- M&A integration — When you acquire a new plant, deploying IIoT with cellular connectivity takes weeks, not months. You get visibility into the acquired operation quickly.
- Customer commitments — When a customer asks about your manufacturing capability and reliability, fleet data gives you auditable, real-time answers.
Ready to see all your plants on one screen? Book a demo and we'll show you what fleet-level manufacturing visibility looks like.