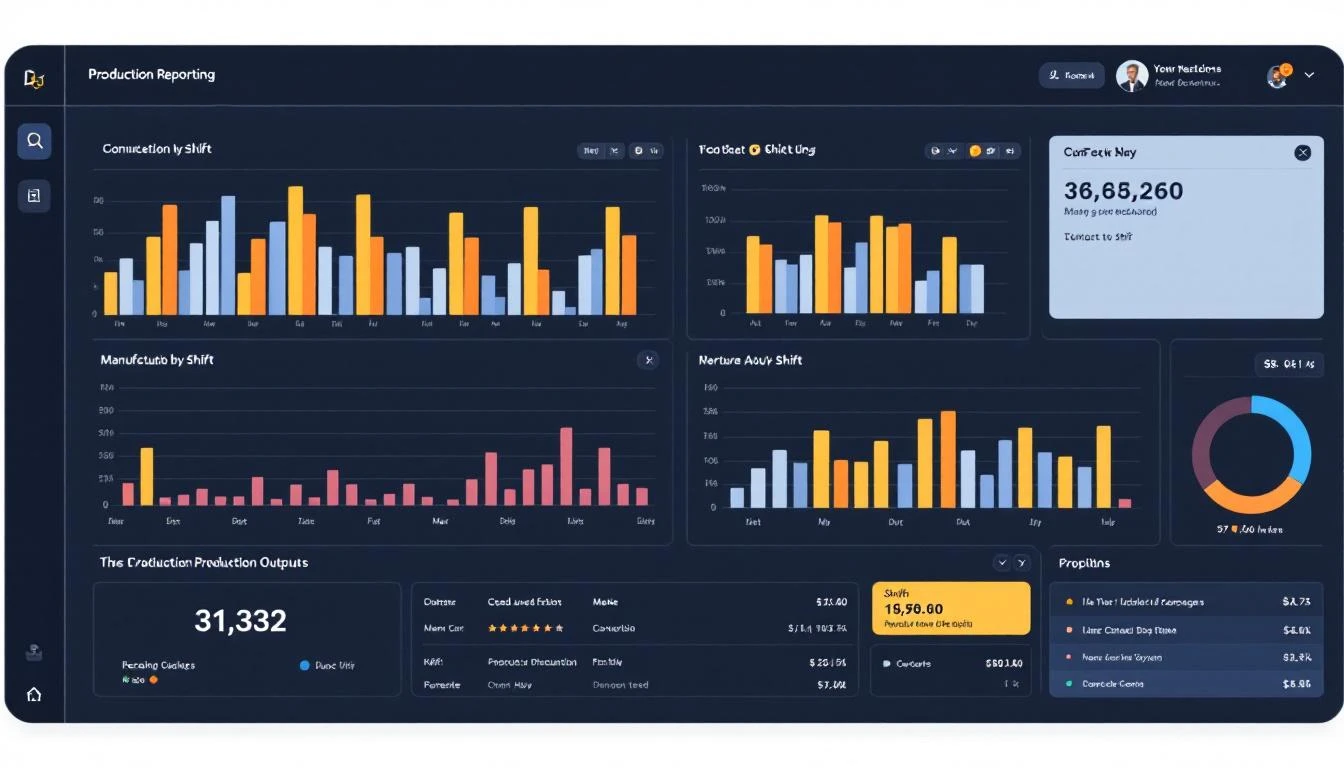
Shift-Based Production Reporting for Manufacturing: How to Compare Output, Quality, and Efficiency Across Shifts
Every manufacturing plant has a shift problem they can feel but can't quantify. First shift runs smoother. Third shift has more scrap. Second shift uses more material. Everyone knows it, but without shift-aligned data, nobody can prove it — let alone fix it. Shift-based production reporting turns anecdotal observations into actionable data. Here's how to implement it and what it reveals.
The Shift Visibility Gap
Most manufacturing plants run 2-3 shifts, covering 16-24 hours of production. Yet their reporting systems often aggregate data by day — hiding dramatic shift-to-shift variations.
Consider this real-world scenario: A plastics manufacturer noticed overall OEE dropped from 78% to 73% over the past quarter. The daily reports showed a gradual decline, but nothing pointed to a cause. When they segmented the data by shift, the picture became crystal clear:
- First shift OEE: 82% (stable)
- Second shift OEE: 76% (slight decline)
- Third shift OEE: 61% (dropped from 72% to 61% over the quarter)
The overall decline was almost entirely driven by third shift. Further investigation revealed a new operator on third shift who was running machines at conservative speeds (worried about scrap) and performing unnecessary changeovers. A few hours of targeted training solved the problem.
Without shift-aligned reporting, this manufacturer would have launched a plant-wide improvement initiative — wasting months investigating first and second shift when they were performing fine.
What Shift-Based Reports Should Include
Effective shift reporting goes beyond parts produced. The most valuable shift-aligned metrics include:
Production Output
- Total units produced per shift
- Units per hour (normalizes for shift duration differences)
- Good units vs. total units (first-pass yield)
- Production against target (% of planned output achieved)
Quality Metrics
- Scrap rate by shift — the most revealing metric. Consistent high scrap on one shift points to training, setup, or process issues.
- Rework count — units that required intervention before passing inspection
- Defect type distribution — do different shifts produce different types of defects?
Equipment Utilization
- Machine running time vs. available time — are machines idle during shift changeovers longer than necessary?
- Number of machine stops per shift — more stops = lower efficiency
- Average stop duration — some shifts restart faster than others
- Alarm frequency — which shifts generate more machine alarms?
Material Consumption
- Raw material consumed per shift — normalized per unit produced, this reveals waste
- Material efficiency ratio — output weight divided by input weight
- Material changeover waste — how much material is wasted during recipe changes?
Energy Consumption
- Energy per unit produced per shift — different operating practices consume different amounts of energy
- Peak demand by shift — third shift often has lower energy rates, incentivizing production scheduling
Maintenance Events
- Unplanned stops by shift — identifies whether breakdowns cluster on specific shifts
- Maintenance response time — how long does it take to get a technician on a machine during each shift?
- PM task completion — are all shifts completing their scheduled preventive maintenance tasks?

Implementing Shift-Based Reporting with IIoT
Traditional approaches to shift reporting rely on manual data entry — operators filling out production logs, handwritten scrap counts, estimated downtime. This data is incomplete, inconsistent, and usually recorded at the end of the shift from memory.
IIoT platforms transform shift reporting by collecting data continuously from PLCs — no manual entry, no estimates, no missing records.
Step 1: Define Shift Schedules
Configure your shift definitions in the IIoT platform:
- Shift start and end times for each shift
- Shift patterns (5-day, 7-day, rotating, 4-on-4-off)
- Break periods (exclude or include in available time calculations)
- Shift names that match your plant nomenclature
Step 2: Map Data Points to Shift Metrics
Identify which PLC data points feed each shift metric:
- Production counters → units produced per shift
- Scrap/reject counters → quality metrics per shift
- Machine state (running/idle/alarm) → utilization per shift
- Material weight/level sensors → consumption per shift
- Energy meters → energy per shift
Step 3: Configure Automated Reporting
The best IIoT platforms generate shift reports automatically after each shift ends. MachineCDN, for example, produces system inventory and material usage reports that appear 15-20 minutes after a shift ends — calculated from actual PLC data, not manual input.
This automation means:
- Reports are ready before the next shift starts
- Incoming shift leaders can review the previous shift's performance during handover
- No operator time is wasted on data entry
- Data is objective and consistent across all shifts
Step 4: Establish Shift Handover Protocols
Shift reporting is most valuable when it's used during shift handover:
- Outgoing shift documents: What happened, what's in progress, what needs attention
- Machine status at handover: Which machines are running, idle, or in alarm
- Material levels: What's available and what needs refilling
- Open maintenance requests: Issues that weren't resolved during the shift
- Quality alerts: Any parameter deviations or quality holds
When this handover is data-driven (from the IIoT system) rather than verbal or paper-based, information transfer is complete and consistent.
What Shift Data Reveals
Once you have shift-aligned reporting running, patterns emerge quickly:
Training Gaps
If one shift consistently produces more scrap on the same machines running the same products, the difference is operator skill. Shift-level data identifies exactly which crews need additional training — without subjective evaluations.
Maintenance Practice Differences
Some shifts are better at running routine checks and catching problems early. The data shows this:
- Shifts that complete PM tasks have fewer unplanned stops
- Shifts that respond to threshold alerts quickly have less severe breakdowns
- Shifts that maintain proper machine warm-up procedures have fewer quality issues in the first hour
Scheduling Optimization
Shift data reveals which products run best on which shifts:
- Complex products may perform better on first shift (more experienced operators, more support staff)
- High-volume commodity products may be ideal for third shift (fewer changeovers, lower energy rates)
- Maintenance-intensive machines might need first-shift production only, with second shift dedicated to PM
Energy Cost Optimization
Utility rates often vary by time of day. Shift reporting combined with energy monitoring reveals:
- Per-unit energy cost by shift (based on actual rates at that time)
- Opportunities to move energy-intensive operations to off-peak shifts
- The real cost difference between running 24/7 vs. 16-hour schedules
Common Mistakes in Shift Reporting
Comparing Shifts Without Normalizing
Third shift often runs with fewer support staff, limited maintenance coverage, and newer operators. Comparing absolute output without accounting for these factors creates unfair comparisons. Normalize for:
- Number of machines operating per shift
- Number of operators per shift
- Product mix (some products have slower cycle times)
- Planned downtime (changeovers, cleaning, PM)
Over-Reporting
A 50-page shift report that nobody reads is worse than no report. Focus on 5-7 key metrics per shift:
- Total units produced vs. target
- Scrap rate
- Machine uptime percentage
- Number of unplanned stops
- Material consumption vs. standard
- Energy consumption
- Open issues for next shift
Not Closing the Loop
Shift reports are diagnostic. They identify problems. But without a process to act on the findings, they're just data. Every shift report review should generate:
- Action items assigned to specific people
- Training requests when skill gaps are identified
- Maintenance work orders when equipment issues surface
- Process parameter changes when optimization opportunities appear
Platform Comparison for Shift Reporting
| Shift Reporting Feature | MachineCDN | MES Systems | Manual/Spreadsheet |
|---|---|---|---|
| Automatic data collection | ✅ From PLC | ✅ From PLC | ❌ Manual entry |
| Shift-aligned material reports | ✅ Auto-generated | ⚠️ Varies | ❌ Manual calculation |
| Report available after shift | ✅ 15-20 minutes | ⚠️ Varies | ❌ Hours/next day |
| Cross-plant shift comparison | ✅ Fleet view | ⚠️ Depends on setup | ❌ Separate spreadsheets |
| Integration with machine health | ✅ Same platform | ⚠️ Often separate | ❌ No integration |
| Cost to implement | Low (IIoT subscription) | High ($100K-$1M+) | Low but unreliable |
The Bottom Line
Shift-based production reporting is one of the highest-ROI capabilities in manufacturing IIoT. It costs nothing extra to segment data you're already collecting by shift — but the insights can save hundreds of thousands of dollars annually through targeted training, optimized scheduling, and faster problem resolution.
If your plant runs multiple shifts and you're reporting in daily aggregates, you're hiding half the story.
See shift-based reporting in action. Book a demo with MachineCDN and we'll show you automated shift reports with material consumption, production output, and quality metrics — generated from your actual machine data.