IIoT for Beverage Bottling Lines: Monitoring Fill Levels, Cap Torque, and Label Accuracy in Real Time
A modern beverage bottling line runs at 600-1,200 bottles per minute. At that speed, a fill level variance of 2ml goes undetected for 30 seconds and you've just sent 450 bottles downstream with the wrong volume — triggering quality holds, potential recalls, and guaranteed retail chargebacks.
Cap torque drifts by 5 in-lbs? You won't know until the line produces 2,000 units with loose caps and consumers find flat soda on shelves. Label misalignment? Your brand manager sees it on Instagram before QA catches it on the floor.
Beverage bottling is one of the highest-speed, lowest-margin manufacturing environments in the world. The difference between a profitable line and a money-losing one often comes down to catching micro-deviations in real time — before they compound into batch rejections.
This is exactly where Industrial IoT transforms operations. Not by replacing your filling machines, but by adding a continuous data layer that catches what human inspection can't at 800 bottles per minute.
The Real Cost of Unmonitored Bottling Lines
Before diving into implementation, let's quantify what's at stake. According to the Beverage Industry Association, the average bottling plant loses 3-7% of production to quality-related waste. On a line producing 50 million bottles per year at $0.85 per unit, that's $1.3M to $3.0M in annual waste.
Breakdown of typical bottling line losses:
| Loss Category | % of Total Waste | Root Cause |
|---|---|---|
| Fill level variance | 25-35% | Filler valve wear, temperature changes, carbonation pressure shifts |
| Cap/closure failures | 15-20% | Torque head drift, cap feeder jams, bottle neck variations |
| Label defects | 10-15% | Adhesive temperature, web tension, sensor calibration |
| Changeover waste | 20-30% | Manual setup, trial-and-error adjustment |
| Unplanned downtime | 15-25% | Bearing failures, belt wear, motor overheating |
IIoT doesn't eliminate all of these losses overnight. But manufacturers who implement real-time monitoring on their bottling lines consistently report 20-30% reductions in quality-related waste within the first 90 days.
Critical Monitoring Points on a Beverage Bottling Line
A typical beverage bottling line has 5-7 major stations, each with distinct monitoring requirements. Here's what to instrument — and what data actually matters at each station.
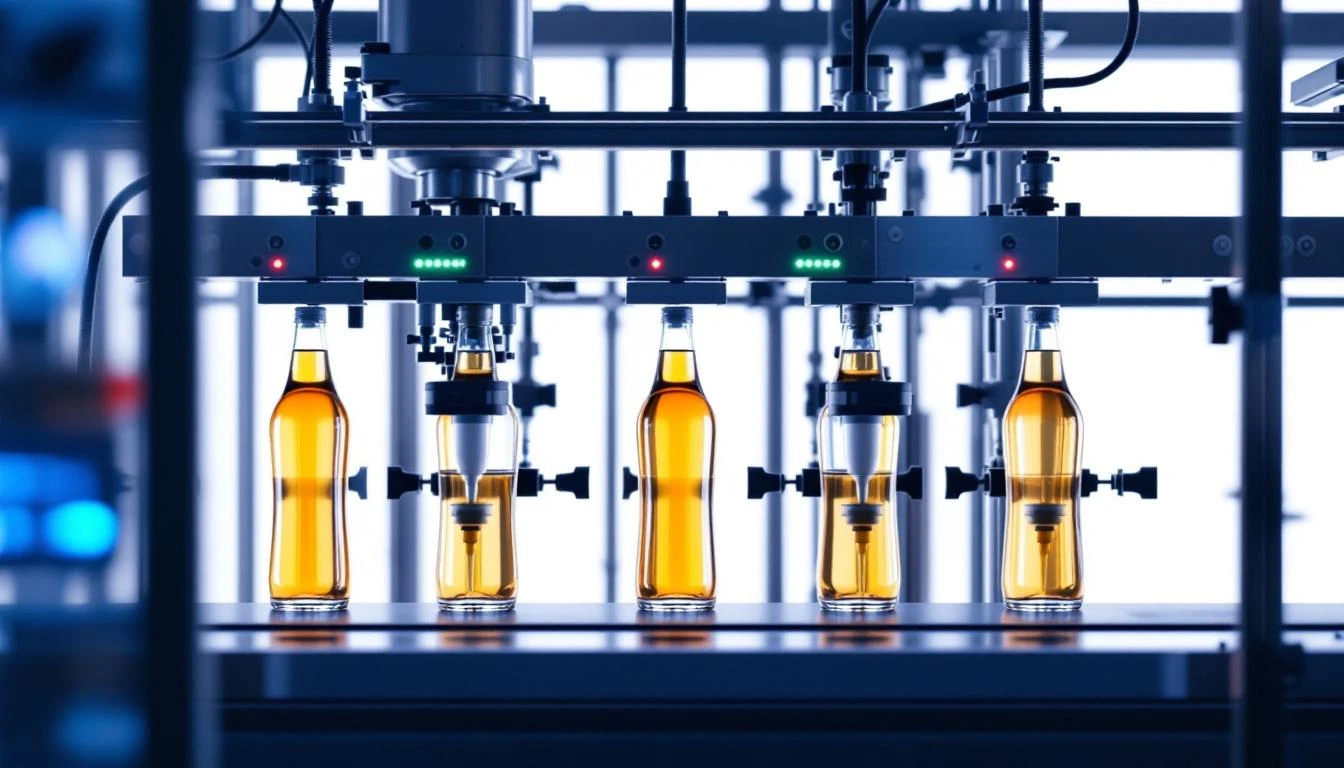
1. Filler Station (Fill Level Monitoring)
The filler is the heart of the bottling line and the single highest-value monitoring point.
Key parameters to monitor:
- Fill volume per valve — Track individual valve performance, not just line averages. One drifting valve can be masked by averaging across 40+ valves.
- Fill temperature — Carbonated beverages expand with temperature. A 2°C shift can change fill volume by 3-5ml.
- CO2 pressure (for carbonated beverages) — Carbonation level directly affects fill volume and foam-over rates.
- Fill time per cycle — Increasing fill time indicates valve wear or product viscosity changes.
- Reject rate per valve — Catch failing valves before they contaminate downstream operations.
Alerting thresholds:
- Fill volume deviation > ±1.5% of target → Warning
- Fill volume deviation > ±3% of target → Critical (potential regulatory issue)
- Fill temperature deviation > ±1.5°C → Warning
- Individual valve reject rate > 2% → Investigation required
Most filler PLCs (Krones, Sidel, KHS, GEA) expose this data via Modbus TCP or Ethernet/IP. Platforms like MachineCDN can connect directly to these controllers and start streaming data in minutes — no integration project required.
2. Capper/Closer Station (Torque Monitoring)
Cap torque is deceptively critical. Too loose and you get leakers and flat carbonated beverages. Too tight and you get consumer complaints (elderly and children can't open) and potential container damage.
Key parameters to monitor:
- Application torque per head — Track each capping head individually
- Removal torque (if you have in-line torque testing) — The actual consumer experience metric
- Cap presence detection — Uncapped bottles are an immediate reject
- Cap orientation (for tamper-evident bands) — Misoriented caps fail at the heat tunnel
- Head pressure — Declining head pressure indicates spring wear
Alert logic:
Application torque should stay within ±8% of target for standard twist-offs. For sports caps, ±5%. If you see torque trending upward over a shift, that's usually spring fatigue in the capping head — schedule maintenance before it fails completely.
3. Labeler Station (Placement and Adhesion Monitoring)
Modern labelers run vision systems that can detect gross placement errors. But subtle drift — a label that's 1mm off-center or adhesive that's releasing early — often slips through.
Key parameters to monitor:
- Label placement accuracy (X/Y offset from nominal) — Vision system data, trended over time
- Adhesive temperature — Hot-melt adhesive needs to stay in a narrow band (typically 140-160°C)
- Web tension — Fluctuating tension causes label stretch or wrinkle
- Label feed speed synchronization — Mismatch between label feed and bottle conveyor speed
- Glue wheel temperature and pattern — For rotary labelers using cold glue
4. Rinser/Sanitizer Station
Before filling, bottles pass through a rinser or sanitizer. This is a food safety checkpoint.
Key parameters to monitor:
- Sanitizer concentration (ppm) — Must stay within regulatory limits
- Rinse water temperature — Cold rinse water on a hot day causes condensation that affects labels
- Rinse time per bottle — Too short = inadequate sanitization. Too long = bottleneck.
- Drain effectiveness — Residual rinse water dilutes the product
5. Inspection Station (Post-Fill Quality)
Most modern lines have an in-line inspection station after filling. Monitor the inspection system itself, not just its pass/fail output.
Key parameters to monitor:
- Inspection rate — Is it keeping up with line speed?
- Reject rate trend — Gradually increasing rejects indicate upstream process drift
- False positive rate — Too many good bottles rejected = wasted product
- Camera/sensor calibration status — Drift in the inspection system is as dangerous as drift in the filler
Implementation Strategy: Start with the Filler
Don't try to instrument the entire bottling line at once. Start with the filler station — it's where the highest-value data lives and where IIoT delivers the fastest ROI.
Week 1: Connect and Baseline
- Connect an edge device to the filler PLC (Modbus TCP or Ethernet/IP)
- Map critical tags: fill volume per valve, temperature, pressure, cycle time
- Collect baseline data for 5-7 days without setting any alerts
- Analyze: What does "normal" look like? What's your valve-to-valve variation?
Week 2-3: Set Thresholds and Alert
- Configure threshold alerts based on baseline data
- Start with wide thresholds (3σ from baseline) and tighten over time
- Route alerts to the line supervisor's mobile device
- Track alert-to-action response time
Week 4-5: Expand to Capper and Labeler
- Add torque monitoring from the capper station
- Add adhesive temperature and label placement data from the labeler
- Correlate: Does filler temperature drift predict label adhesion issues 20 minutes later?
Week 6+: Predictive Insights
- Use historical data to predict valve failures before they cause quality events
- Optimize changeover parameters based on data from previous changeovers
- Build OEE dashboards specific to each product SKU
This phased approach mirrors MachineCDN's 5-week ROI framework — start small, prove value, then expand. Most beverage manufacturers see measurable quality improvements within the first three weeks of connecting their filler data.
Beverage-Specific IIoT Challenges (and Solutions)
Challenge 1: Washdown Environments
Beverage plants wash down everything — floors, equipment, control panels — multiple times per day. Standard industrial IoT devices can survive this, but placement matters.
Solution: Mount edge devices and gateways in NEMA 4X enclosures rated for washdown. Keep antennas (for cellular connectivity) above the splash zone. MachineCDN's cellular edge devices are designed for industrial environments, but even robust hardware needs proper placement.
Challenge 2: High Line Speeds
At 1,000+ bottles per minute, data volume gets serious quickly. Monitoring 40 filler valves at 10 readings per second per valve = 400 data points per second = 34.5 million data points per day.
Solution: Use edge computing to process data at the source. Send aggregated statistics (min, max, mean, standard deviation per valve per minute) to the cloud, not raw readings. Keep raw data at the edge for troubleshooting, with a 72-hour rolling buffer.
Challenge 3: Multi-SKU Changeovers
A typical beverage plant runs 10-30 different SKUs on the same line. Each SKU has different fill volumes, cap types, label sizes, and carbonation levels. Every changeover resets the process parameters.
Solution: Store optimal parameters per SKU in your IIoT platform. When a changeover starts, automatically load the target thresholds and alert limits for the new SKU. Track changeover time and first-bottle-good metrics to continuously optimize the process.
Challenge 4: Seasonal Temperature Variation
Ambient temperature affects everything in a bottling plant — product viscosity, CO2 solubility, adhesive performance, even PET bottle dimensions. A line that runs perfectly in October may have fill level issues in July.
Solution: Monitor ambient temperature as a process variable and correlate it with quality metrics. Build seasonal adjustment tables that automatically tighten or loosen alert thresholds based on ambient conditions.
Integration with Existing Quality Systems
Most beverage manufacturers already have quality management systems — SAP QM, Intelex, MasterControl, or at minimum an Excel-based HACCP log. IIoT shouldn't replace these systems; it should feed them.
Integration approaches:
- Automated HACCP logging — Write critical control point data (sanitizer concentration, fill temperature) directly from the IIoT platform to your HACCP records. Eliminates manual logging errors and provides continuous (not hourly) documentation.
- SPC/SQC feeds — Send statistical process control data from the IIoT platform to your quality system for trending and analysis.
- Deviation alerts — When an IIoT threshold is breached, automatically create a deviation record in your quality system with the associated data.
Calculating ROI for Beverage Bottling IIoT
The ROI calculation for beverage bottling IIoT is straightforward because the waste is measurable.
Conservative assumptions for a mid-size bottling line (500 BPM):
| Metric | Before IIoT | After IIoT (90 days) | Annual Impact |
|---|---|---|---|
| Fill level waste | 4% of production | 2.5% of production | ~$500K saved |
| Cap-related rejects | 1.2% | 0.6% | ~$180K saved |
| Label waste | 0.8% | 0.4% | ~$120K saved |
| Unplanned downtime | 45 hrs/year | 30 hrs/year | ~$225K saved |
| Total annual savings | ~$1.025M |
Against a typical IIoT platform cost of $3K-10K/month (depending on the number of lines and monitoring points), the payback period is measured in weeks, not years.
MachineCDN customers in food and beverage manufacturing consistently report ROI within 5 weeks — driven primarily by fill level waste reduction and faster identification of equipment drift.
Key Metrics Dashboard for Bottling Line Managers
Your bottling line IIoT dashboard should answer these questions at a glance:
- Are all lines running? — Real-time machine status with color-coded indicators
- Are we hitting fill targets? — Per-valve fill volume with 3σ control limits
- Is quality trending up or down? — Rolling 4-hour reject rate trend
- What's our OEE right now? — Live OEE calculation by line and by SKU
- Are there any approaching alarms? — Threshold alerts that catch problems before they become rejects
- How did last shift perform? — Shift-based production reports with quality breakdown
Conclusion
Beverage bottling lines generate enormous volumes of data that, when captured and analyzed in real time, can eliminate 20-30% of quality-related waste. The key is starting with the filler station — the highest-value monitoring point — and expanding systematically to cappers, labelers, and inspection systems.
The technology exists to connect any bottling line PLC to a modern IIoT platform. Whether your filler runs Siemens, Rockwell, or Mitsubishi, the data is accessible via standard industrial protocols.
The question isn't whether you can monitor your bottling line in real time — it's how much waste you're willing to tolerate while you wait.
Book a demo with MachineCDN to see how beverage manufacturers are connecting their bottling lines in minutes, not months.
Running a beverage bottling operation? Book a demo to see real-time fill level, torque, and quality monitoring in action.