Production Line Monitoring: How to Get Real-Time Visibility Into Your Manufacturing Operations
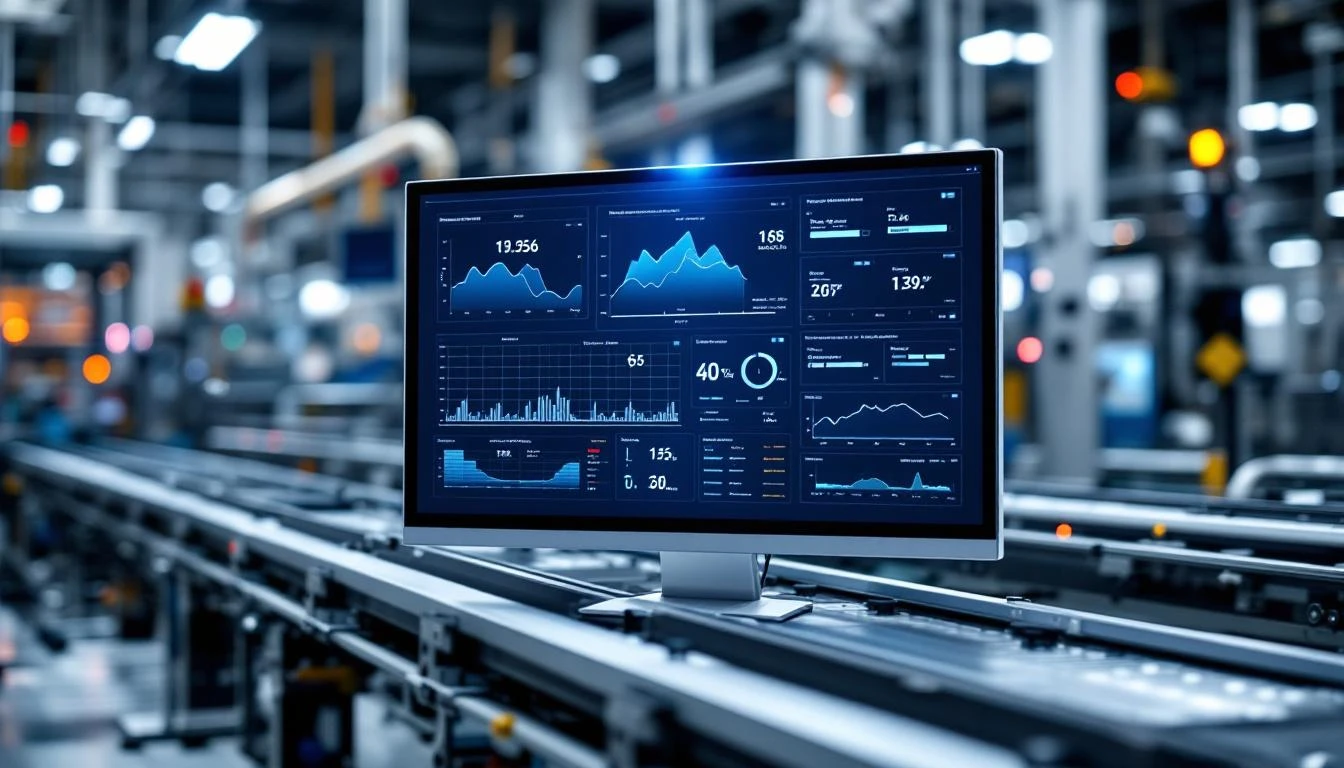
Your production line is running. But do you actually know how well it's running — right now, not based on yesterday's report?
Most manufacturers operate with surprisingly limited real-time visibility into their production lines. They know daily output numbers. They know when something breaks. But the gap between "machine is running" and "machine is running at optimal capacity" is where millions of dollars in productivity hide. A study by Aberdeen Group found that best-in-class manufacturers with real-time production monitoring achieve 89% OEE compared to 72% for average manufacturers — a 17-point gap that translates directly to output, quality, and profitability.
This guide covers what production line monitoring actually involves, the metrics that matter, common pitfalls, and how modern IIoT platforms make real-time manufacturing visibility achievable — even for plants without dedicated IT teams.
What Is Production Line Monitoring?
Production line monitoring is the continuous collection and analysis of data from manufacturing equipment to understand performance, detect problems, and optimize output. At its core, it answers three questions in real time:
- Are machines running? (Availability)
- Are they running at target speed? (Performance)
- Are they producing good parts? (Quality)
These three dimensions combine into Overall Equipment Effectiveness (OEE) — the gold standard metric for manufacturing efficiency. For a detailed breakdown, see our complete guide to calculating OEE.
But production line monitoring goes beyond OEE. A comprehensive monitoring system tracks:
- Machine states — running, idle, changeover, maintenance, alarm
- Cycle times — actual vs. target production speeds per part/job
- Throughput — units produced per hour, shift, or day
- Downtime events — when machines stop, why they stopped, and how long
- Bottlenecks — which stations constrain overall line throughput
- Energy consumption — power usage per machine, per shift, per part
- Material flow — raw material consumption rates and waste
- Quality events — reject rates, scrap, and rework triggers
The Cost of Not Monitoring
Before discussing how to monitor production lines, let's quantify what happens when you don't.
Hidden capacity loss: Most manufacturers believe their equipment utilization is 75-85%. When they actually measure it, the number is typically 55-65%. That 20-point gap represents machines sitting idle, running below speed, or producing scrap — without anyone knowing.
Undetected micro-stoppages: Machines that stop for 30 seconds to 2 minutes often don't get reported. Operators restart the equipment, and the stoppage never appears in any log. Across a shift, these micro-stoppages can consume 10-15% of available production time.
Late problem detection: Without real-time monitoring, problems are discovered when downstream stations run out of parts, when quality inspections catch defects, or when end-of-shift numbers miss targets. By then, hours of production have been affected.
Inaccurate capacity planning: If you don't know your true throughput rates, you can't plan production accurately. This leads to missed delivery dates, excessive overtime, or over-investment in equipment you might not need.

What to Monitor: Key Metrics for Production Lines
Machine-Level Metrics
Availability — The percentage of planned production time that a machine is actually running. Target: >90%.
Formula: Available Time = Planned Production Time - Downtime
Performance Rate — How fast the machine runs compared to its ideal cycle time. A machine running at 80% of its designed speed has a performance rate of 80%.
Formula: Performance = (Ideal Cycle Time × Total Count) / Run Time
Quality Rate — The percentage of parts that meet specifications on the first pass (first-pass yield).
Formula: Quality = Good Count / Total Count
OEE — The product of all three: OEE = Availability × Performance × Quality
World-class OEE is 85%+. Most manufacturers operate between 60-75%.
Line-Level Metrics
Throughput — Total units produced per time period. Track actual vs. planned to identify gaps.
Takt Time Adherence — Are you producing at the rate needed to meet customer demand? Takt time = available production time ÷ customer demand.
Bottleneck Identification — Which station has the lowest throughput? Line output can never exceed the bottleneck's capacity.
Work-in-Process (WIP) — Inventory between stations. High WIP before a station indicates it's a bottleneck. Low WIP after a station indicates it's starving downstream.
Changeover Duration — Time lost when switching between products or jobs. Tracking this enables SMED (Single-Minute Exchange of Die) improvement programs.
Plant-Level Metrics
Capacity Utilization — Actual output vs. maximum possible output across the entire plant.
Energy per Unit — Total energy consumed divided by units produced. Important for cost management and sustainability reporting.
Schedule Adherence — Percentage of jobs completed on time. A leading indicator of customer delivery performance.
Data Collection Methods: From Manual to Automated
Manual Collection (Paper-Based)
Still used in many plants: operators fill in production logs, record downtime events on paper, and end-of-shift totals are entered into spreadsheets.
Problems: Data is delayed by hours or shifts. Accuracy depends on operator diligence. Micro-stoppages are rarely recorded. Analysis is retrospective only.
Semi-Automated (SCADA + Manual)
SCADA systems capture machine states and basic counts, but operators still log downtime reasons, quality events, and contextual information manually.
Problems: Better than paper but still has gaps. SCADA data stays in the control room. Integration with business systems requires custom development.
Fully Automated (IIoT Platforms)
Modern IIoT platforms like MachineCDN connect directly to PLCs, automatically capturing:
- Machine states (running, idle, alarm) in real time
- Production counts and cycle times
- Alarm events with timestamps and categorization
- Energy consumption per machine
- Downtime duration with automatic detection
Human input is only needed for context that machines can't provide — downtime reason codes, quality reject reasons, and job assignments.
How Modern IIoT Platforms Enable Production Line Monitoring
The gap between legacy monitoring and modern IIoT is architectural. Here's what a platform like MachineCDN changes:
Direct PLC Connectivity
Every modern manufacturing machine has a PLC (Programmable Logic Controller) that controls its operation. PLCs contain real-time data about machine states, cycle counts, temperatures, pressures, speeds, and alarms. The question is how to extract that data.
Traditional approach: Install an OPC server ($5,000-$15,000), configure tag mapping, connect to SCADA, build custom reports. Timeline: weeks to months. Cost: $50,000-$200,000 per line.
MachineCDN approach: Connect an edge device to the plant network. The device communicates directly with PLCs via Ethernet/IP and Modbus — the native languages of industrial controllers from Rockwell, Siemens, ABB, and others. Auto-discovery identifies available data points. Data flows within minutes.
Cellular Connectivity: The IT Bypass
One of the most underappreciated barriers to production monitoring is the IT department. Connecting factory equipment to the corporate network requires:
- Security reviews and firewall configurations
- Network segmentation and VLAN setup
- Bandwidth allocation and QoS policies
- Ongoing network monitoring and management
This process takes 4-12 weeks in many organizations — not because IT is slow, but because plant network security is legitimately complex. A misconfigured IoT device could compromise production control systems.
MachineCDN uses cellular data connectivity, completely bypassing the plant network. The edge device transmits data over cellular networks directly to the cloud. IT doesn't need to approve anything because the plant network isn't involved. This single architectural decision eliminates what is typically the longest delay in IIoT deployments.
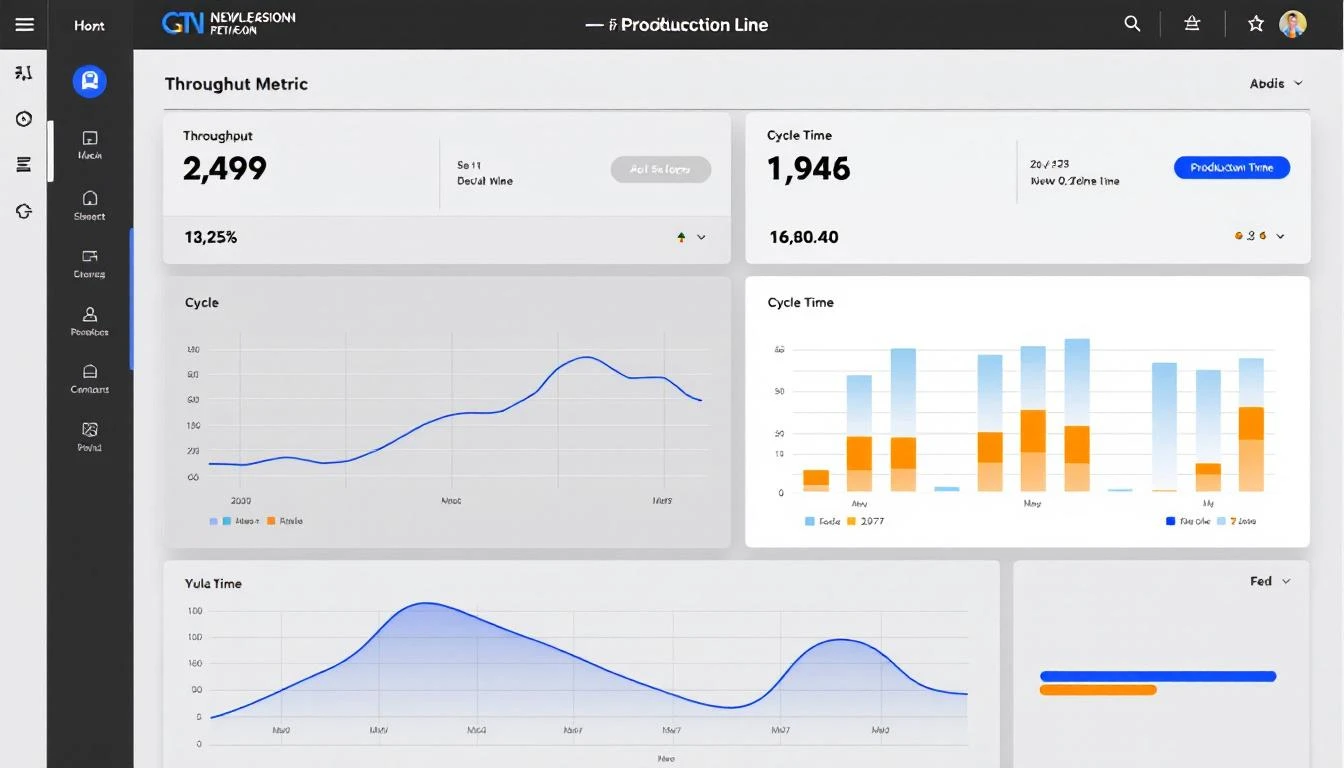
Real-Time Dashboards vs. End-of-Shift Reports
With automated data collection, production metrics are available in real time — not at the end of a shift or the next morning. This enables:
Immediate problem response: When a machine stops or slows, supervisors see it instantly. Response time drops from "next shift" to minutes.
Intra-shift adjustments: If throughput is trailing target at the halfway point, supervisors can reallocate resources, adjust scheduling, or escalate maintenance before the shift ends.
Cross-shift visibility: Night shift supervisors see exactly what happened during day shift — and vice versa — without relying on handwritten notes.
Automated Downtime Tracking
MachineCDN automatically detects when machines stop and records the duration. Combined with operator-entered reason codes, this creates a complete downtime Pareto that shows:
- Top downtime reasons by duration
- Downtime frequency by machine
- Planned vs. unplanned downtime split
- Downtime trends over time
This data drives continuous improvement programs. When you can see that Machine #7's changeovers take 23 minutes while Machine #12's take 8 minutes for the same job, you have an actionable insight.
For more on reducing downtime, read our practical guide to reducing unplanned downtime.
Common Pitfalls in Production Line Monitoring
Monitoring Everything, Analyzing Nothing
Collecting 10,000 data points per second is easy. Turning that data into decisions is hard. Start with the metrics that drive action — OEE components, throughput, and top downtime reasons — before expanding to advanced analytics.
Ignoring the Human Element
Technology captures data; people provide context. The most effective monitoring systems make it easy for operators to add information (downtime reasons, quality observations) without disrupting their workflow. If the system creates work for operators, they'll stop using it.
Over-Engineering the Solution
Some plants spend $500,000 on a monitoring system that takes 18 months to deploy. Meanwhile, a simpler solution could have been running in a week, identifying problems that cost $100K/month. Perfect is the enemy of good — especially in manufacturing.
Not Acting on the Data
The biggest sin in production monitoring: collecting data and not using it. Every monitored metric should have:
- A target or benchmark
- A person responsible for reviewing it
- A defined escalation path when it deviates
- A regular review cadence (daily, weekly)
Data without action is just expensive storage.
Building a Production Monitoring Strategy
Phase 1: Visibility (Weeks 1-4)
- Connect machines to an IIoT platform
- Establish baseline metrics (OEE, throughput, downtime)
- Create real-time dashboards visible to operators and supervisors
- Begin automatic downtime tracking
Phase 2: Analysis (Weeks 5-12)
- Identify top downtime causes and bottleneck stations
- Compare performance across shifts, machines, and products
- Set targets based on best-observed performance
- Launch improvement projects for top losses
Phase 3: Prediction (Months 3-6)
- Use accumulated data for predictive maintenance
- Implement AI-powered anomaly detection
- Build predictive models for throughput forecasting
- Integrate with maintenance management and spare parts systems
Phase 4: Optimization (Ongoing)
- Continuous improvement driven by data
- Cross-plant benchmarking for multi-site operations
- Energy optimization per unit of production
- Advanced scheduling based on real capacity data
The Bottom Line
Production line monitoring isn't about installing sensors and building dashboards. It's about giving manufacturing teams the information they need to make better decisions, faster. The manufacturers who win — the ones hitting 85%+ OEE and delivering on time consistently — aren't smarter than their competitors. They just see their operations clearly.
Modern IIoT platforms have eliminated the barriers that used to make real-time production monitoring a luxury reserved for the biggest manufacturers. A platform like MachineCDN can connect to your PLCs in minutes, start tracking OEE automatically, and provide the visibility that turns gut-feeling management into data-driven manufacturing.
For more on manufacturing analytics, explore our guides to factory floor analytics, equipment health monitoring, and the best machine monitoring software.
Want to see your production line in real time? Book a MachineCDN demo and get visibility into your operations within minutes.