Building a Data-Driven Maintenance Culture: How to Move Your Team from Reactive to Predictive
You can buy the best IIoT platform on the market, install sensors on every machine, and build dashboards that would make a NASA flight controller jealous. None of it matters if your maintenance technicians don't trust the data, your supervisors still prioritize reactive work over preventive tasks, and your plant manager measures success by how many fires your team put out this month rather than how many they prevented.
The technology for predictive maintenance has been ready for years. What hasn't been ready — in most manufacturing organizations — is the culture. And culture, not technology, determines whether a predictive maintenance program succeeds or becomes an expensive decoration.
Deloitte's 2024 manufacturing study found that while 82% of plant managers report having "some form of predictive maintenance capability," only 23% describe their program as "effective at preventing unplanned downtime." The 59-point gap between capability and effectiveness isn't a technology problem. It's a people problem.
This guide addresses that gap head-on. Not with platitudes about "change management" and "executive sponsorship" — with specific, practical steps for transforming a maintenance organization from reactive to data-driven.

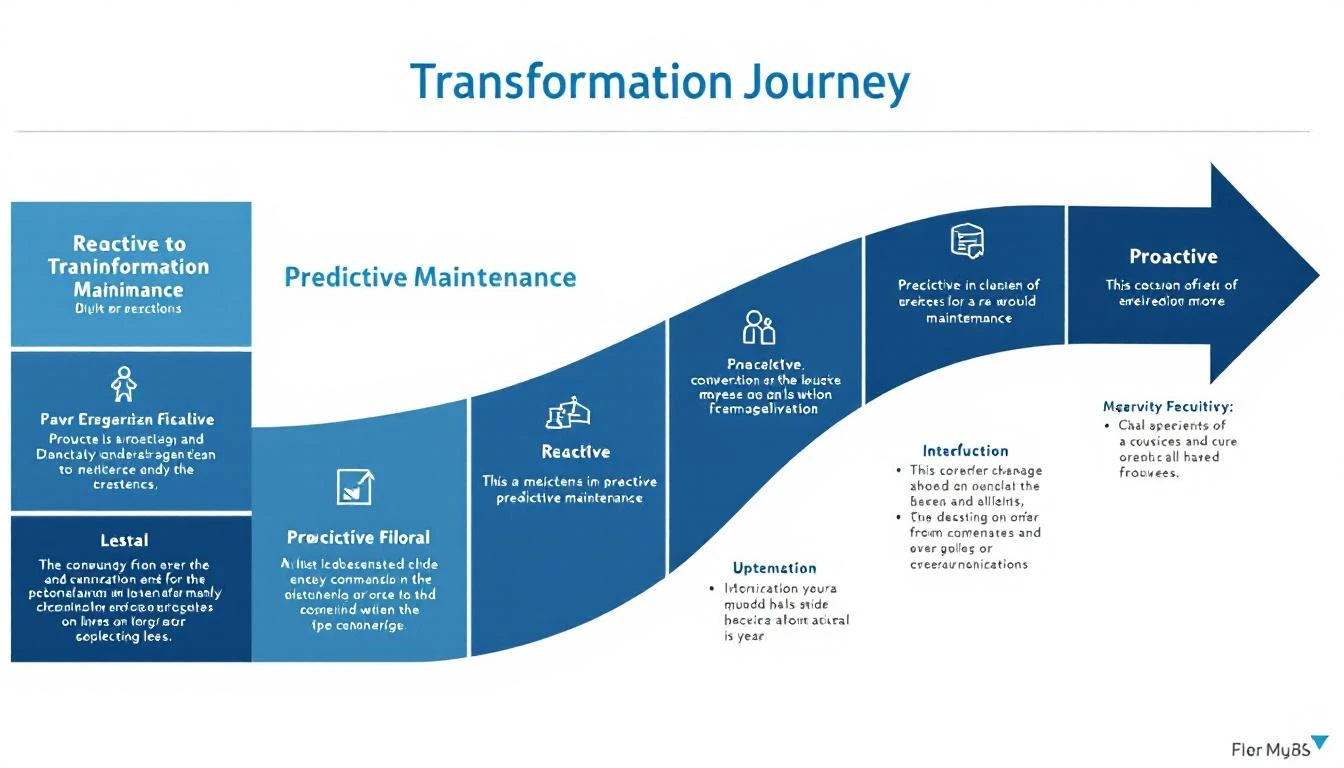
The Five Stages of Maintenance Maturity
Before you can move forward, you need to know where you are. Most manufacturing organizations fall into one of five maturity stages:
Stage 1: Reactive (Run-to-Failure)
Characteristics: Equipment is maintained only when it breaks. No scheduled maintenance program. Parts are ordered after failures occur. Maintenance is a cost center measured by repair speed, not prevention.
Percentage of industry: Roughly 30% of manufacturing operations, predominantly small and mid-size facilities.
The problem: Reactive maintenance costs 3-10x more than preventive maintenance per equipment hour, according to the U.S. Department of Energy. A bearing that costs $50 to replace preventively costs $5,000-$50,000 when it fails catastrophically (including the bearing, collateral damage, emergency labor, and lost production).
Stage 2: Preventive (Time-Based)
Characteristics: Equipment is maintained on fixed schedules (every 90 days, every 500 hours). PM compliance is tracked. Parts are stocked for scheduled maintenance. Maintenance is still a cost center, but with a budget and a plan.
Percentage of industry: Roughly 40% of manufacturing operations.
The problem: Time-based maintenance doesn't account for actual equipment condition. You replace bearings at 1,000 hours whether they need it or not — over-maintaining good bearings and under-maintaining stressed ones. According to the Electric Power Research Institute, only 12% of equipment follows a predictable age-related failure pattern. Time-based maintenance is optimized for the wrong 12%.
Stage 3: Condition-Based (Monitoring-Informed)
Characteristics: Equipment condition is monitored (vibration, temperature, oil analysis). Maintenance decisions are informed by condition data, but interpretation is manual. A vibration analyst reviews spectra monthly. Oil samples are sent to a lab. Decisions are made by experienced practitioners.
Percentage of industry: Roughly 20% of manufacturing operations.
The problem: Condition monitoring with manual interpretation has gaps. Monthly vibration routes miss rapid deterioration events. Lab-based oil analysis has a 2-week turnaround. The condition data is periodic, not continuous, and the analysis depends on specialist expertise that's expensive and increasingly scarce.
Stage 4: Predictive (AI-Informed)
Characteristics: Continuous, automated monitoring with AI-powered pattern recognition. The system learns normal operating patterns and detects anomalies automatically. Maintenance is planned based on predicted remaining useful life. Spare parts are ordered proactively. Threshold alerts are configured with graduated severity levels.
Percentage of industry: Roughly 8% of manufacturing operations.
This is where the real transformation happens. And it's where culture becomes the bottleneck.
Stage 5: Prescriptive (Optimized)
Characteristics: The system not only predicts failures but recommends specific actions, optimal timing, and resource allocation. Maintenance is integrated with production scheduling, inventory management, and financial planning. The maintenance organization is measured on asset availability, MTBF improvement, and maintenance cost per unit produced.
Percentage of industry: Less than 2% of manufacturing operations.
This is the destination. But you can't leap from Stage 1 or 2 to Stage 5. Each stage builds on the previous one.
The Cultural Barriers (and How to Break Through Them)
Barrier 1: "We've Always Done It This Way"
This is the most common and most deeply rooted cultural barrier. Experienced maintenance technicians have spent decades building intuitive knowledge about their equipment. They can hear a bearing going bad, feel a vibration change through the floor, smell an overheating motor. Asking them to trust a computer display instead of their senses feels like an insult to their expertise.
How to break through:
Position IIoT as an amplifier, not a replacement. The experienced tech who can hear a bad bearing at 20 feet can now detect it across 500 machines simultaneously, 24/7, including on the night shift when they're sleeping. Their expertise is the foundation that IIoT builds on.
Let them configure the system. Have your most experienced technicians define the alarm thresholds, the failure modes to watch for, and the response protocols. When the system reflects their knowledge, they own it instead of resisting it.
Celebrate the first save. The moment the IIoT platform catches a failure that would have been missed on a manual round, make it visible. Put it in the shift report. Mention it in the plant meeting. The technician who responded to the alert gets credit — the system just pointed them in the right direction.
Barrier 2: "Maintenance Heroes" Culture
In many plants, the highest-status maintenance role is the crisis responder — the tech who gets the call at 2 AM, drives in, and gets the line running by 6 AM. These "maintenance heroes" are celebrated, promoted, and compensated for their fire-fighting ability.
This culture is profoundly counterproductive. It rewards failure (a breakdown had to occur for the hero to respond) and penalizes prevention (nothing to fix means nothing to celebrate).
How to break through:
Redefine heroism. The new hero is the technician who investigated an alert during a scheduled shift, identified a degrading bearing, planned the replacement during a scheduled downtime window, and avoided a $50K production loss. That's not as dramatic as a midnight rescue, but it's worth 10x more to the organization.
Change the metrics. Stop measuring maintenance success by response time (how fast we fix breakdowns). Start measuring by prevention rate (how many breakdowns we prevented), MTBF improvement (how much longer between failures), and planned vs. unplanned maintenance ratio.
Target: 80/20. World-class maintenance organizations achieve 80% planned maintenance, 20% unplanned. Most reactive organizations are reversed — 80% unplanned, 20% planned. Track this ratio monthly and set a 3-year target to reach 80/20.
Barrier 3: "We Don't Have Time for Preventive Work"
This is the maintenance catch-22: the team is so busy responding to breakdowns that they can't do the preventive work that would reduce breakdowns. Every PM task that gets deferred because "we had a breakdown on Line 4" creates the conditions for the next breakdown.
How to break through:
Schedule PM like production. Preventive maintenance tasks should be scheduled in the production plan, not squeezed into gaps between breakdowns. If PM is optional, it won't happen.
Start small. You don't need to implement a full PM program on day one. Pick the 5 machines that cause the most unplanned downtime (your IIoT platform's historical data will tell you exactly which ones). Implement monitoring and scheduled PM on those 5 machines. As breakdowns decrease, capacity freed up from emergency repairs funds expansion to the next 5 machines.
Quantify the cost of deferral. When a PM task is deferred, log the reason and the estimated risk. "Deferred Line 7 bearing inspection due to Line 4 motor failure. Estimated risk: $15K if bearing fails in next 30 days." Making the cost visible changes the decision calculus.
Barrier 4: Data Trust Deficit
Maintenance teams that have been burned by bad data — false alarms from poorly calibrated sensors, dashboards that show incorrect values, reports that don't match what the tech sees on the floor — develop deep skepticism toward data-driven anything.
How to break through:
Fix the data quality first. Before asking anyone to trust data-driven decisions, ensure the data is accurate. Calibrate sensors. Verify that dashboard values match physical readings. Fix the easy wins that rebuild trust.
Transparency over black boxes. Show technicians the raw data behind every alert. "The bearing temperature on Machine 7 has increased 18°F over the past 3 days. Here's the trend chart. Here's the alert threshold. What do you think?" This invites collaboration, not compliance.
Track prediction accuracy. When the system predicts a failure, follow up. Was the prediction correct? If yes, document it. If no, investigate why and improve. Publish the prediction accuracy rate monthly. As accuracy climbs toward 80-90%, trust follows.
The Practical Implementation Plan
Month 1-2: Foundation
- Deploy IIoT monitoring on your top 10 highest-impact machines
- Establish baselines for all critical parameters
- Involve experienced technicians in threshold configuration
- Begin tracking planned vs. unplanned maintenance ratio
Month 3-4: Build Trust
- Review every alert with the maintenance team — actionable or noise?
- Fine-tune thresholds based on team feedback
- Celebrate the first predictive save
- Begin transitioning 2-3 PM tasks from time-based to condition-based
Month 5-6: Expand and Measure
- Scale monitoring to next 20 machines
- Introduce OEE tracking tied to maintenance activities
- Begin monthly maintenance performance reviews (MTBF, planned/unplanned ratio, alert accuracy)
- Identify and promote "prevention heroes"
Month 7-12: Institutionalize
- All critical equipment under continuous monitoring
- Maintenance planning driven by equipment condition data, not calendar
- Spare parts ordering triggered by predictive alerts
- Maintenance team contributing to threshold refinement and alert configuration
- Planned/unplanned ratio approaching 70/30 (on track for 80/20 target)
Technology That Supports Cultural Change
The right IIoT platform doesn't just provide data — it supports the cultural transformation. Features that matter:
Intuitive dashboards that non-specialists can use. If the maintenance tech needs a vibration analyst to interpret the data, you've created a bottleneck and a dependency. The dashboard should present information in terms the team already understands — temperature, vibration severity, equipment health scores.
Mobile-first alerts. Maintenance techs don't sit at desks. They need alerts on their phones, with enough context to assess severity and plan response without opening a laptop.
Built-in maintenance management. If the IIoT platform detects a problem but the tech has to log into a separate CMMS to create a work order, you've added friction that reduces compliance. Integrated maintenance management — PM scheduling, work orders, spare parts tracking — keeps the workflow in one system.
AI that learns and improves. A platform that gets better over time — reducing false positives, improving prediction accuracy, adapting to seasonal changes — reinforces the team's trust. A platform that generates the same percentage of false alarms in month 12 as it did in month 1 will lose the team's confidence.
MachineCDN was designed with this cultural transformation in mind. 3-minute setup means the technology doesn't become a 6-month implementation project that exhausts organizational patience before it delivers value. AI-powered predictive maintenance learns each machine's patterns and gets more accurate over time. Built-in PM scheduling and spare parts tracking keep the workflow unified. And cellular connectivity means IT bottlenecks don't slow down the transformation.
The Payoff: What a Data-Driven Maintenance Organization Looks Like
When the cultural transformation succeeds, here's what changes:
- Unplanned downtime drops 40-60%. Not because equipment stops breaking — because you catch problems weeks before they become failures.
- Maintenance costs decrease 15-25%. Planned repairs cost a fraction of emergency repairs. Parts are ordered at standard lead times, not overnight-shipped at premium prices.
- Equipment life extends 20-40%. Condition-based maintenance replaces both over-maintenance (unnecessary replacements) and under-maintenance (running to failure).
- Maintenance team morale improves. Planned work is less stressful than firefighting. Technicians feel in control of their equipment, not controlled by it.
- Institutional knowledge is preserved. When experienced technicians retire, their knowledge isn't lost — it's encoded in the alert thresholds, failure modes, and response protocols they configured.
The technology enables the transformation. But the transformation itself is cultural. It happens in conversations, in meetings, in the moment when a maintenance supervisor looks at a dashboard instead of waiting for the phone to ring.
Book a demo and see how MachineCDN's platform supports the shift from reactive to predictive — not just with technology, but with the intuitive, trusted experience that maintenance teams need to change how they work.