Energy Monitoring for Plastics Factories: Cut Costs Without Cutting Output
Electricity doesn't just power a plastics factory — it defines its profitability. For most plastics processors, energy represents 20–30% of total manufacturing cost, second only to raw resin. Yet the vast majority of plants have no visibility into where those kilowatt-hours actually go. The utility bill arrives, someone winces, and everyone moves on.
That approach worked when energy was cheap. In 2026, with industrial electricity rates climbing past $0.12/kWh in many regions and sustainability reporting becoming a procurement requirement, ignorance isn't bliss — it's margin erosion.
Per-machine energy monitoring changes the equation entirely. When you can see exactly how many kWh each injection molding press, extruder, or auxiliary system consumes per pound of resin processed, you stop guessing and start optimizing.
Why Plastics Manufacturing Is an Energy Hog
Plastics processing is inherently energy-intensive. The physics of melting polymer pellets at 200–350°C, forcing them through molds or dies under thousands of PSI, and then cooling the result demands enormous thermal and mechanical energy.
Here's where the energy actually goes in a typical injection molding facility:
- Barrel heating and screw drive motors: 50–65% of total machine energy
- Hydraulic pump systems: 15–30% (on hydraulic presses)
- Cooling systems (chillers, cooling towers): 10–20%
- Auxiliary equipment (dryers, blenders, conveyors, robots): 5–15%
- Compressed air: 5–10%
- HVAC and lighting: 5–8%
The problem isn't just the total consumption — it's the variability. Two identical 500-ton injection molding machines running the same mold can consume dramatically different amounts of energy depending on hydraulic system condition, barrel heater efficiency, cycle time optimization, and operator behavior.
A study by the U.S. Department of Energy found that plastics processors can typically reduce energy consumption by 10–30% through monitoring and optimization alone — no capital equipment purchases required.
Per-Machine kWh Monitoring: The Foundation
The first step to energy optimization is granular measurement. Plant-level utility data tells you nothing actionable. You need per-machine, per-cycle energy data correlated with production output.
What to Measure
Effective energy monitoring in a plastics factory tracks several key metrics at the machine level:
Specific Energy Consumption (SEC) is the most important metric — energy consumed per kilogram of product (kWh/kg). This normalizes for production volume and lets you compare machines, molds, materials, and shifts on equal footing. A well-run injection molding operation typically achieves 0.5–1.2 kWh/kg depending on part geometry and material.
Demand Profile captures not just total consumption but the power draw pattern over time. A hydraulic press's demand profile looks like a series of spikes (clamping, injection, hold) with valleys between. Understanding this profile reveals opportunities for cycle optimization and demand charge reduction.
Idle Power Consumption is the energy a machine burns while not producing parts. Many hydraulic presses consume 30–50% of their running power while sitting idle — the hydraulic pump runs continuously even when the machine is between cycles or waiting for an operator. This is pure waste.
Auxiliary Energy covers the dryers, hopper loaders, temperature controllers, and robots attached to each machine. These auxiliaries can represent 15–25% of the total energy footprint of a workcell, and they're almost never monitored independently.
Real-Time Visibility Changes Behavior
When you install per-machine energy monitoring and display real-time kWh data on a dashboard visible to the floor, something interesting happens: energy consumption drops 5–8% within the first month before any formal optimization program begins.
This is the Hawthorne effect applied to energy. Operators who can see that their press is consuming 20% more than the identical machine next to it start investigating. Maintenance teams who can see that a chiller is running continuously even when the press is idle start questioning why.
Platforms like MachineCDN provide this real-time energy visibility per machine, per zone, and per location — letting plant managers identify energy anomalies in minutes rather than waiting for the monthly utility bill. The built-in threshold alerting can flag when a machine's energy consumption deviates from its baseline, catching issues like degraded barrel heaters or failing hydraulic pumps before they become costly problems.
Identifying Energy Hogs: The 80/20 of Plastics Energy
In every plastics factory, a small number of machines and systems consume a disproportionate share of energy. Finding them is the fastest path to savings.
The Usual Suspects
Older hydraulic injection molding presses are almost always the biggest energy hogs. A 20-year-old hydraulic 500-ton press with a fixed-displacement pump can consume 40–60% more energy per cycle than a modern servo-hydraulic or all-electric equivalent. The hydraulic pump runs at full speed regardless of actual demand, dumping excess flow over a relief valve as heat — which then requires additional cooling energy to remove.
Oversized machines running small molds create massive inefficiency. A 1,000-ton press running a mold that only needs 400 tons of clamp force wastes energy on every cycle. The clamp mechanism, screw drive, and hydraulic system are all doing more work than necessary. Energy monitoring data makes this mismatch visible by showing SEC values far above benchmark for the part weight being produced.
Material dryers with poor insulation or oversized capacity can consume 15–25 kWh per hour while drying resin that the press consumes at a rate requiring only a fraction of that capacity. Monitoring dryer energy alongside throughput reveals these mismatches.
Compressed air leaks are the silent energy thief of every plastics factory. A single 1/4-inch leak at 100 PSI wastes approximately $2,500–$3,500 per year in energy. Most plants have dozens of leaks. While not strictly per-machine monitoring, correlating compressed air system energy with production schedules reveals leak-driven waste.
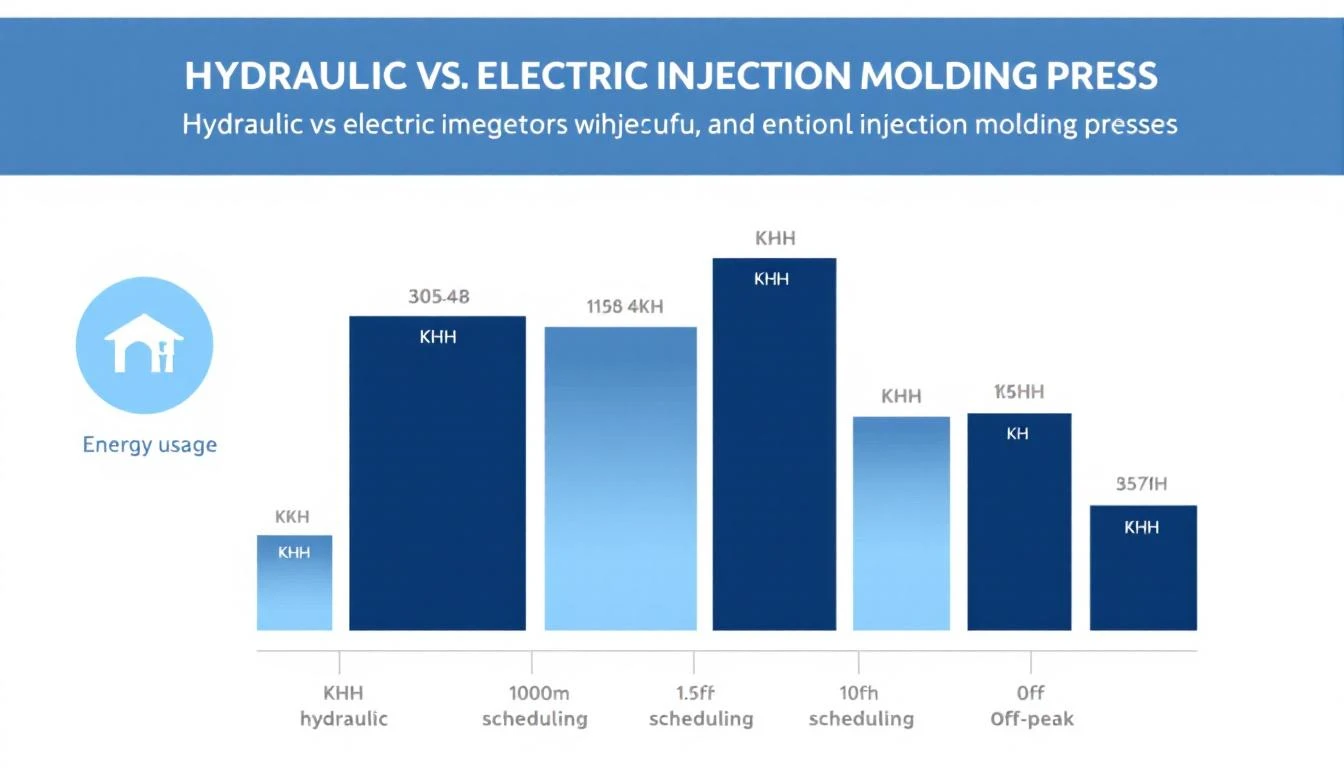
Hydraulic vs. Electric Press Optimization
The hydraulic-versus-electric press decision is one of the highest-impact energy choices in plastics manufacturing. Understanding the energy profiles of each — and optimizing your fleet accordingly — can yield 30–60% energy savings on affected machines.
Hydraulic Press Energy Profile
Traditional hydraulic injection molding machines use a constant-speed motor driving a fixed-displacement pump. The pump runs at full speed whenever the machine is powered on, regardless of whether the machine is actively cycling. Energy consumption looks like this:
- During cycle: High demand during clamp, injection, and hold phases
- Between cycles: Pump still runs at full speed, energy wasted as heat
- During idle: 40–60% of full-cycle energy consumption (pure waste)
The result: a hydraulic press might consume 25–35 kWh during a production hour and 12–18 kWh during an idle hour.
Servo-Hydraulic: The Middle Ground
Modern servo-hydraulic presses replace the constant-speed motor with a variable-speed servo motor. The pump only runs when hydraulic pressure is needed, dramatically reducing energy waste during idle and low-demand phases. Typical energy savings: 30–50% vs. conventional hydraulic.
All-Electric Press Energy Profile
All-electric presses use servo motors to directly drive the clamp, injection, and ejection mechanisms — no hydraulic system at all. Benefits include:
- No idle energy waste: Motors only draw power during active movement
- Regenerative braking: Energy is recovered during deceleration phases
- Precise energy control: Power draw exactly matches mechanical demand
- No hydraulic oil: Eliminates oil cooling energy (and oil replacement costs)
An all-electric press typically consumes 50–70% less energy than an equivalent-tonnage hydraulic press. For a 300-ton press running 24/7, that translates to $15,000–$25,000 per year in energy savings.
Using Monitoring Data to Optimize Your Fleet
Per-machine energy monitoring lets you make data-driven decisions about your press fleet:
- Identify the worst hydraulic offenders: Sort machines by SEC (kWh/kg) and flag those significantly above benchmark
- Quantify the upgrade ROI: With actual consumption data, you can calculate exact payback periods for servo-hydraulic retrofits or all-electric replacements
- Optimize job scheduling: Route low-energy molds to electric presses and high-tonnage jobs to hydraulic machines where the energy differential is smaller relative to the total process energy
- Monitor retrofit impact: After upgrading a machine, track SEC improvement to validate the investment
MachineCDN's machine monitoring capabilities make this fleet-level analysis straightforward. By tracking energy consumption alongside production data — cycle times, shot weights, and part counts — you can calculate SEC for every machine-mold combination and identify the most impactful optimization opportunities across your fleet.
Off-Peak Scheduling: Making the Grid Work for You
Industrial electricity pricing isn't flat. Most plastics factories are on time-of-use (TOU) or demand-based rate structures where the cost per kWh varies dramatically by time of day and the peak demand charge can represent 30–50% of the total bill.
Understanding Your Rate Structure
Time-of-Use Rates: Energy costs more during peak demand hours (typically 12:00–18:00 weekdays) and less during off-peak hours (nights, weekends). The differential can be 2–3x. If your peak rate is $0.15/kWh, your off-peak rate might be $0.06/kWh.
Demand Charges: The utility charges based on your highest 15-minute average power demand during the billing period. One spike — starting multiple large presses simultaneously, for example — can add thousands of dollars to your monthly bill.
Scheduling Strategies
With per-machine energy data, you can implement intelligent production scheduling:
Shift energy-intensive molds to off-peak hours. If a mold requires a 1,000-ton hydraulic press consuming 45 kWh per hour, running it during off-peak hours at $0.06/kWh instead of peak hours at $0.15/kWh saves $3.96/hour — roughly $95/day for a single machine.
Stagger machine startups to avoid demand charge spikes. Instead of powering up all 20 presses at shift start, sequence startups over 30–45 minutes. This can reduce peak demand by 30–40%, directly reducing demand charges.
Schedule dryer warm-up and material preheating before peak hours. If dryers take 2–3 hours to bring resin to spec, start them at 4:00 AM so they're consuming energy during off-peak rates and ready for production at shift start.
Run chillers harder during off-peak to build thermal reserve. Many facilities can sub-cool process water during cheap-energy hours and coast during peak hours, reducing chiller demand when electricity is most expensive.
Quantifying the Opportunity
For a mid-size plastics facility consuming 500,000 kWh per month, shifting just 20% of consumption from peak to off-peak hours can save $6,000–$10,000 per month depending on rate differentials. Combined with demand charge management, total savings can reach $100,000–$150,000 annually — with zero impact on production output.
The key is visibility: you can't shift what you can't see. Per-machine energy monitoring provides the data foundation for intelligent scheduling, and platforms like MachineCDN let you correlate energy consumption with production schedules to identify the highest-value opportunities. The OEE tracking capabilities built into the platform mean you can verify that production efficiency isn't sacrificed when schedules change.
Beyond Monitoring: Predictive Energy Management
Basic energy monitoring tells you what's happening now. Predictive energy management tells you what's about to happen — and what to do about it.
Detecting Degradation Through Energy Signatures
Every machine has an energy signature — a characteristic pattern of power draw across its operating cycle. When that signature changes, something has changed mechanically. Common examples in plastics processing:
- Rising barrel heater energy: Degraded heater bands or thermocouple drift — the system compensates by running heaters longer
- Increasing hydraulic system energy: Internal pump wear causing volumetric efficiency loss, or accumulator pre-charge loss
- Growing cooling energy: Fouled heat exchangers, degraded coolant, or blocked cooling channels in molds
- Climbing screw drive energy: Worn screw/barrel causing reduced plasticizing efficiency, requiring more mechanical energy per shot
These energy signature changes often appear weeks before a machine failure or quality defect. Catching them early through predictive maintenance approaches means you fix a $500 problem instead of dealing with a $50,000 unplanned downtime event.
Energy-Aware Process Optimization
Advanced energy monitoring also enables process optimization that most plastics processors never attempt:
Optimal barrel temperature profiling: By correlating barrel heater energy with melt quality and part dimensions, you can find the minimum-energy temperature profile that still produces acceptable parts. Many processors run barrel temperatures 10–20°C hotter than necessary "just in case" — wasting 5–10% of barrel heating energy.
Cycle time optimization with energy context: Reducing cycle time by 1 second saves energy per part, but the relationship isn't linear. Sometimes a slightly longer cooling time reduces chiller energy enough to net-save overall. Energy monitoring reveals these counterintuitive tradeoffs.
Mold changeover energy management: Mold changes typically waste 30–60 minutes of machine energy while the new mold heats up, barrel temperatures stabilize, and the process reaches steady state. Monitoring this transition energy and optimizing changeover procedures can reduce per-changeover waste by 20–30%.
Connecting Energy to Sustainability Reporting
Energy monitoring isn't just about cost reduction anymore. Plastics processors are increasingly required to report their carbon footprint and energy intensity to customers, particularly those supplying automotive, consumer electronics, and medical device OEMs.
Per-machine energy data enables:
- Carbon footprint per part: Multiply kWh/part by your grid emission factor to get kg CO₂ per part
- Scope 2 emissions tracking: Automated, auditable energy data for sustainability reports
- Customer-specific reporting: Some OEMs require energy/carbon data at the part number level
- Continuous improvement documentation: Year-over-year energy intensity trends that demonstrate progress
With regulators and customers increasingly demanding this data, having automated, per-machine energy monitoring in place positions your facility ahead of the curve. The scrap reduction benefits compound with energy monitoring — every rejected part wastes both material and the energy consumed to produce it.
Getting Started: A Pragmatic Implementation Roadmap
You don't need to instrument every machine on day one. Start where the impact is highest:
Phase 1 — Identify the top 5 energy consumers (usually the largest tonnage hydraulic presses). Install per-machine monitoring and establish baseline SEC values. This alone often reveals $50,000–$100,000 in annual savings opportunities. A platform like MachineCDN can have a machine connected and reporting data within minutes, with zero involvement from your IT team — the cellular connectivity bypasses plant network complexity entirely.
Phase 2 — Expand to auxiliaries and cooling systems. Add monitoring to chillers, dryers, and compressed air. Correlate auxiliary energy with production machine data to find system-level inefficiencies.
Phase 3 — Implement scheduling optimization. Use the data from phases 1 and 2 to shift loads, stagger startups, and manage demand charges.
Phase 4 — Deploy predictive energy analytics. Establish energy signature baselines and configure alerts for deviations that indicate mechanical degradation or process drift.
Most plastics facilities that follow this roadmap achieve 15–25% total energy reduction within the first year, with payback on monitoring investment in 5–8 weeks.
The Bottom Line
Energy is the largest controllable cost in plastics manufacturing. Unlike resin prices (which you can't control) or labor costs (which change slowly), energy consumption responds immediately to informed decision-making.
Per-machine energy monitoring transforms energy from an opaque monthly bill into a controllable, optimizable process variable. Whether you're comparing hydraulic versus electric press efficiency, scheduling production around rate structures, or detecting mechanical degradation through energy signature analysis, the foundation is the same: real-time, granular, per-machine data.
The factories that win on cost in 2026 and beyond won't be the ones with the cheapest energy contracts. They'll be the ones that know exactly where every kilowatt-hour goes — and make each one count.
Ready to see where your energy is going? Book a demo and get per-machine energy monitoring running in your plastics facility in minutes, not months.