IoTFlows vs MachineCDN for Fleet Management: Multi-Plant Monitoring Compared
Managing machines across multiple manufacturing plants is one of the hardest operational challenges in industrial IoT. When your extruders in Ohio, injection molders in Mexico, and assembly lines in Texas all need real-time visibility, the fleet management capabilities of your IIoT platform become mission-critical. Here's how IoTFlows and MachineCDN approach multi-plant monitoring — and where the differences matter.
Why Fleet Management Matters More Than Single-Plant Monitoring
A 2024 McKinsey study on manufacturing operations found that multi-site manufacturers waste 15-25% of maintenance budgets because they can't compare equipment performance across locations. A machine running optimally at Plant A might be consuming 30% more energy at Plant B doing the same job — but without cross-site visibility, nobody knows.
Fleet management in IIoT means:
- Unified dashboard showing every machine across every plant
- Cross-location comparison of the same machine types
- Standardized alerting so maintenance policies are consistent
- Centralized reporting for operations managers who oversee multiple facilities
- Spare parts visibility across all locations — not just one plant's stockroom
IoTFlows Fleet Management Capabilities
IoTFlows provides cloud-based monitoring that can aggregate data from multiple sites. Their approach works through:
Multi-Site Data Aggregation
IoTFlows sensors at each location connect through gateways that push data to their cloud platform. Operations managers can view machine health scores, OEE metrics, and downtime analysis across all connected sites from a single dashboard.
Machine Health Scoring
IoTFlows' AI engine generates health scores across seven metrics (cavitation, looseness, imbalance, lubrication, alignment, bearing, temperature). These scores can be compared across identical machines at different plants — useful for identifying which locations have better maintenance practices.
Production Tracking
Shift-based production tracking allows comparison of output across sites. If your Detroit plant runs three shifts and your Monterrey plant runs two, you can compare per-shift productivity metrics.
Limitations for Fleet Management
Where IoTFlows encounters constraints in multi-plant scenarios:
- Sensor deployment at each location: Every new plant requires full physical installation of SenseAi sensors on every machine. For manufacturers expanding into new facilities, this means weeks of installation per site.
- No built-in materials or inventory tracking: Fleet management isn't just about machine health. Knowing material levels, hopper status, and inventory across all plants is critical for operations — and IoTFlows doesn't cover this.
- No spare parts cross-referencing: When Plant A has a surplus of bearings and Plant B needs them urgently, cross-location spare parts visibility saves thousands. This isn't part of IoTFlows' feature set.
MachineCDN Fleet Management: Built for Multi-Plant Operations
MachineCDN's fleet management module was designed from the ground up for manufacturers running multiple facilities. The platform's architecture supports locations, zones within locations, and machine-level drill-downs — creating a hierarchical view that mirrors how operations managers actually think about their plants.
Hierarchical Fleet Overview
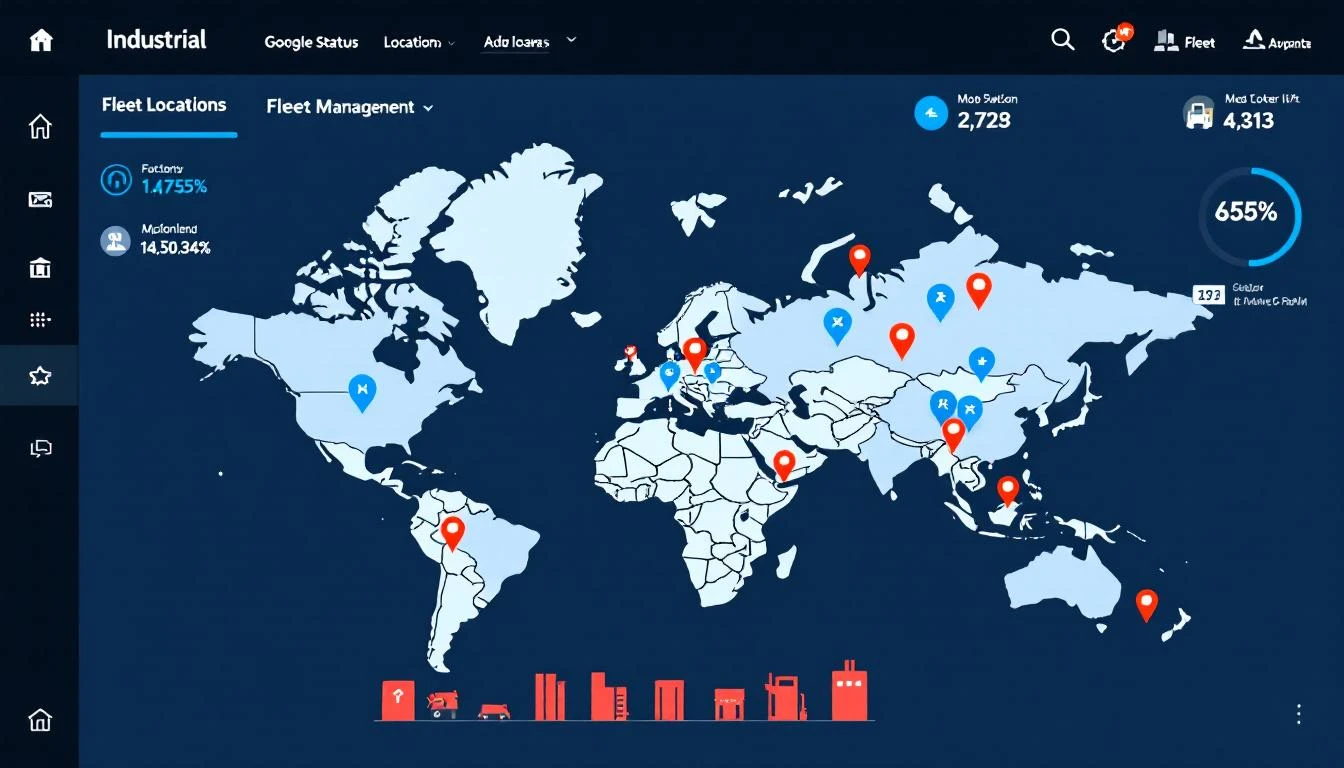
The fleet overview gives operations leaders a single screen showing:
- All locations with summary status (machines running, idle, in alarm)
- Zone-level drill-down within each location — separate production areas, assembly cells, or departments
- Machine-level detail with real-time status and historical performance
This three-tier hierarchy (location → zone → machine) means a VP of Operations can check all 12 plants in one glance, then drill into a specific facility, then into a specific production zone, then into the individual machine that's showing anomalous behavior.
Fleet Performance Analytics
The fleet performance view compares key metrics across all locations:
- Spare parts consumption by location — which plants are burning through parts faster?
- Machine type distribution — how many of each equipment type across the fleet?
- Company-level aggregation — for organizations managing machines across multiple business units or subsidiary companies
These charts use visual analytics (bar graphs, distribution charts) that make cross-plant comparison intuitive for non-technical stakeholders.
Failure Analysis Across the Fleet
MachineCDN's fleet-level failure analysis correlates failure patterns across all locations. When the same model of CNC machine fails at three plants within the same month, the system surfaces this pattern — enabling fleet-wide maintenance responses rather than reactive plant-by-plant firefighting.
Materials and Inventory Across Locations
This is where fleet management extends beyond machine health into operational intelligence:
- Material usage reports by location, zone, and machine
- Inventory levels visible across all plants — enabling transfer decisions
- Hopper monitoring for materials that feed into production processes
- Scheduled shift reports comparing material consumption by shift across sites
Spare Parts Visibility
The part management module tracks spare parts inventory across the entire fleet. When a critical motor fails at your smallest plant and they don't stock the replacement, fleet-level visibility shows that your largest plant has two spares — and a transfer can happen the same day instead of waiting 6 weeks for a new order.
Rapid Multi-Site Deployment
Because MachineCDN connects directly to existing PLCs using standard industrial protocols, deploying to a new plant takes hours — not weeks. Ship an edge device, plug it into the plant network (or activate cellular connectivity), and the new facility appears in the fleet dashboard within minutes.
For manufacturers with acquisition strategies — buying new plants regularly — this deployment speed is a significant competitive advantage.
Head-to-Head Comparison
| Fleet Management Feature | IoTFlows | MachineCDN |
|---|---|---|
| Multi-location dashboard | ✅ | ✅ |
| Location → zone → machine hierarchy | Limited | ✅ Full 3-tier |
| Cross-plant machine comparison | ✅ Health scores | ✅ Full analytics |
| Cross-plant failure correlation | Limited | ✅ Fleet failure analysis |
| Materials tracking across plants | ❌ | ✅ |
| Spare parts cross-referencing | ❌ | ✅ |
| New plant deployment time | 1-3 weeks | Hours (3-min per device) |
| IT involvement for new site | Required (Wi-Fi/network) | Optional (cellular available) |
| Energy monitoring by location | Limited | ✅ Built-in |
| Shift-based cross-site comparison | ✅ | ✅ |
| Custom reports across fleet | Limited | ✅ Full report builder |
When Multi-Plant Monitoring Breaks Down
The hardest part of fleet management isn't the dashboard — it's getting consistent data across all sites. Common problems:
Data Standardization
Different plants often have different PLC brands, different tag naming conventions, and different network setups. MachineCDN handles this at the edge device level — auto-detecting PLC types and normalizing data before it reaches the cloud. IoTFlows handles this through their sensor layer, which provides consistent data regardless of the underlying equipment.
Network Connectivity
Plants in rural areas or international facilities may have unreliable internet. MachineCDN's cellular option eliminates this entirely — the edge device uses cellular connectivity independent of the plant network. For IoTFlows, each sensor gateway needs reliable network connectivity, which can require infrastructure investment at remote sites.
Scale Economics
At 5+ plants, the cost difference between approaches compounds. Sensor hardware costs multiply linearly with each new site, while protocol-native connectivity uses dramatically less hardware per site.
Real-World Scenario: 8-Plant Manufacturer
Consider a plastics manufacturer with 8 plants across North America:
- Total machines: 250 across all sites
- PLC coverage: 90% (225 machines have PLC control)
- Goal: Unified OEE, downtime, materials, and maintenance visibility
IoTFlows approach: Install SenseAi sensors on 250 machines (750+ sensors at 3 per machine), plus 20+ gateways, plus Wi-Fi upgrades at each site. Timeline: 3-6 months for full deployment. Cost: significant capital expenditure.
MachineCDN approach: Ship 16-24 edge devices (2-3 per plant), plug in, configure. Timeline: 2-4 weeks for full fleet coverage. Immediate access to materials tracking, spare parts, and fleet analytics that IoTFlows doesn't provide.
The remaining 25 machines without PLCs might need a sensor-based solution — but that's 10% of the fleet, not 100%.
Making the Fleet Decision
For manufacturers evaluating fleet management:
- Count your plants and growth plans. If you're acquiring facilities, deployment speed matters enormously.
- Assess beyond machine health. Do you need materials tracking, spare parts, and inventory across sites? These are table stakes for operational fleet management.
- Test network requirements. If your plants have unreliable connectivity, cellular-first approaches avoid infrastructure costs.
- Calculate fleet-wide TCO — not per-plant costs.
Ready to see fleet management across your plants? Book a demo with MachineCDN and bring your plant list — we'll show you what unified fleet visibility actually looks like.