Best Real-Time Manufacturing Dashboard Software 2026: See Your Factory in Real Time
A manufacturing dashboard isn't useful if it shows you what happened yesterday. By the time you're reading yesterday's production report, the scrap is already in the bin, the machine has been down for 8 hours, and your best customer's order is late.
Real-time manufacturing dashboards change the equation. They show you what's happening right now — which machines are running, which are idle, which are alarming, and how your shift is tracking against plan. The difference between a 5-second data refresh and a next-day report is the difference between catching a problem and cleaning up after one.
Here's what the best real-time dashboard platforms deliver in 2026, and how to pick the right one for your operation.
What "Real-Time" Actually Means in Manufacturing
Let's start with an important distinction. Not all platforms mean the same thing when they say "real-time":
- True real-time (sub-second to 5 seconds): Data refreshes as fast as the PLC scans — you see changes within seconds of them happening on the machine. Critical for process control, quality monitoring, and alarm response.
- Near-real-time (5–60 seconds): Data refreshes every few seconds to a minute. Adequate for OEE tracking, production monitoring, and shift management.
- Polling-based (1–15 minutes): The platform checks for new data periodically. OK for daily reporting but misses short events like micro-stops, quick alarms, and intermittent issues.
- Batch/upload-based (hourly or daily): Data is collected and uploaded periodically. This is NOT real-time, regardless of what the marketing page says.
For this guide, we're focusing on platforms that deliver true real-time or near-real-time dashboards with data latency under 60 seconds.
The 6 Best Real-Time Manufacturing Dashboard Platforms
1. MachineCDN — Best for Instant Factory Visibility Across All Equipment
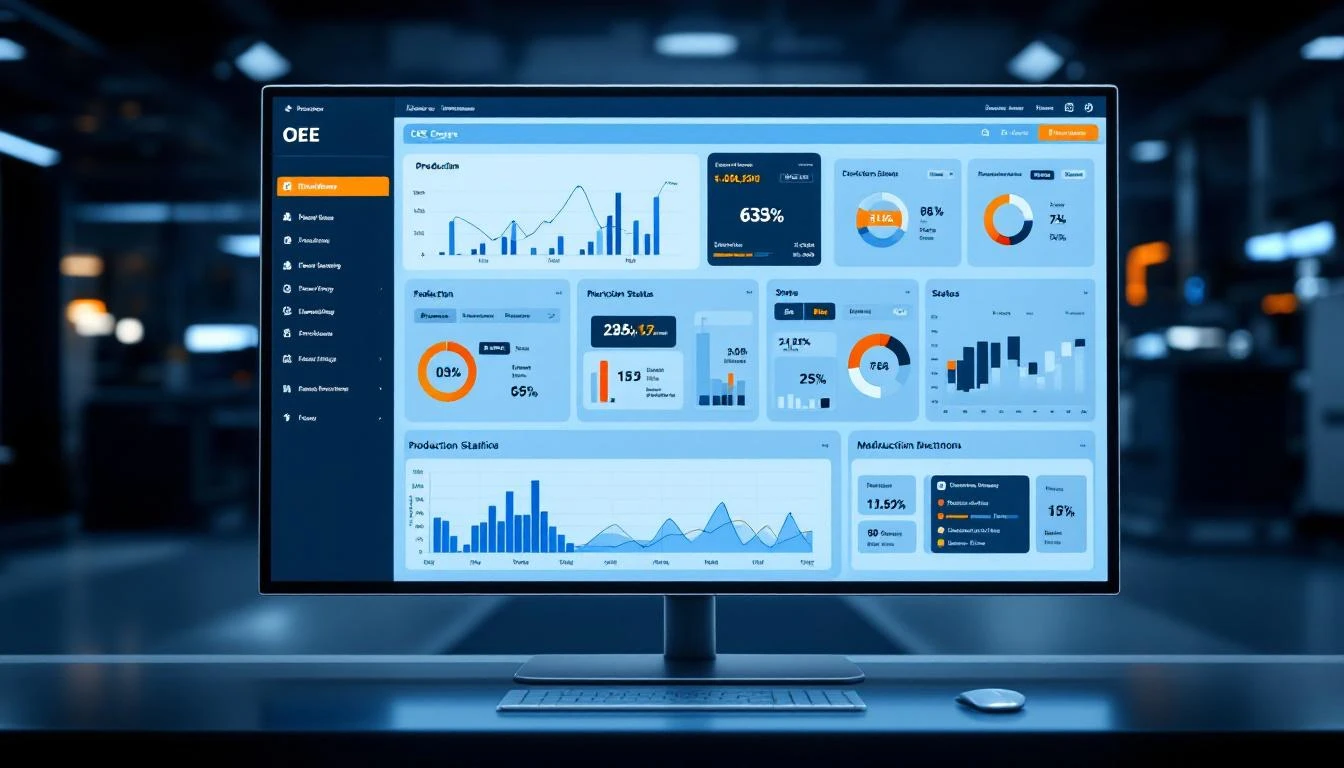
MachineCDN's dashboard architecture is built around streaming machine data from edge to cloud in near-real-time. The platform reads PLC tags at configurable intervals — from 1-second scans for critical process variables to 60-second scans for ambient monitoring — and renders that data on web-based dashboards accessible from any device.
Dashboard capabilities:
- Live machine status view — running, idle, alarm, offline states updated in real time for every connected machine
- OEE dashboard — availability, performance, and quality metrics with drill-down into each component
- Fleet overview — all machines across all locations on one screen, filterable by zone, location, or machine type
- Alarm dashboard — active alarms with type, severity, duration, and status — color-coded by priority
- Threshold alerts — configurable approaching and active levels with visual indicators
- Downtime analysis — real-time downtime categorization with reason codes and duration tracking
- Energy consumption — per-machine power usage displayed alongside production data
- Custom reports — drag-and-drop report builder with tag selection, time ranges, and export capabilities
What makes it different: MachineCDN dashboards come pre-built and ready to use out of the box. You're not hiring a developer to build custom screens — you connect your machines, and the dashboards populate automatically. The 3-minute setup means you can go from zero visibility to full real-time dashboards within a single shift.
Data refresh: Configurable from 1–60 second intervals per tag.
Access: Web-based, any device, no VPN required.
Book a demo →
2. MachineMetrics — Best for CNC Production Dashboards
MachineMetrics delivers excellent real-time dashboards for CNC machine shops. Their production dashboard shows machine states, spindle utilization, cycle times, and part counts with second-level granularity.
Dashboard strengths:
- CNC-specific metrics (spindle utilization, feed rate, program progression)
- Expected vs. actual cycle time comparison
- Part count tracking with good/scrap differentiation
- Shift and operator performance views
Limitations:
- Dashboard capabilities are CNC-focused — limited value for non-CNC equipment
- Customization requires professional services or API development
- No built-in maintenance, inventory, or energy dashboards
- Requires plant network connectivity (no cellular option)
3. Ignition Perspective — Best for Fully Custom SCADA Dashboards
Ignition's Perspective module lets you build completely custom dashboards — from simple machine status screens to complex process visualizations with mimic diagrams, trends, and interactive controls.
Dashboard strengths:
- Unlimited customization — design any screen you can imagine
- Mobile-responsive layouts that work on phones and tablets
- Real-time data from OPC UA, Modbus, and other protocols
- Scripting support for dynamic content and calculations
- Unlimited client connections per license
Limitations:
- You're building dashboards, not using pre-built ones — expect weeks to months of development
- Requires Ignition developers or trained integrators
- Server infrastructure needed (on-premises or cloud)
- No built-in AI/ML for predictive insights
- Not a SaaS product — you own the infrastructure
4. Grafana + InfluxDB — Best for Technical Teams Who Want Full Control
Grafana (with an industrial time-series database like InfluxDB or TimescaleDB) is the open-source darling of technical manufacturing teams. If you have engineers who can write queries and configure data sources, Grafana delivers beautiful, real-time dashboards at near-zero software cost.
Dashboard strengths:
- Free and open-source (Grafana Community Edition)
- Beautiful, highly customizable visualizations
- Supports dozens of data sources simultaneously
- Active community with thousands of pre-built dashboard templates
- Alerting engine with routing to email, Slack, PagerDuty, etc.
- Sub-second refresh rates with streaming support
Limitations:
- Not a turnkey solution — requires significant configuration and data pipeline setup
- No built-in industrial protocol connectivity (you need a separate data collector like Node-RED, Telegraf, or Kepware)
- No maintenance management, work orders, or operational features
- Dashboard creation requires InfluxQL or Flux query knowledge
- You're responsible for hosting, backup, scaling, and maintenance
Best for: Manufacturing companies with DevOps/data engineering capabilities who want maximum flexibility and control.
5. Tulip — Best for Operator-Facing Production Dashboards
Tulip provides a no-code dashboard builder designed for frontline manufacturing teams. Their strength is making it easy for production supervisors — not developers — to build and modify dashboards.
Dashboard strengths:
- No-code dashboard builder accessible to non-technical users
- Good integration with digital work instructions and quality tracking
- Operator-facing design (large text, clear status indicators, touchscreen-friendly)
- Machine and sensor data alongside human process data
- Easy to iterate and modify (change a dashboard in minutes, not days)
Limitations:
- Real-time data refresh is slower than dedicated IIoT platforms
- Limited depth in machine-level analytics and trending
- Not designed for complex process visualization
- IoT connectivity is basic — no deep PLC integration
- Scaling across multiple plants requires enterprise planning
6. Sight Machine — Best for AI-Augmented Manufacturing Dashboards
Sight Machine layers AI-driven insights on top of manufacturing data. Their dashboards don't just show you what's happening — they highlight anomalies, suggest optimizations, and identify patterns across production runs.
Dashboard strengths:
- AI/ML-powered anomaly detection surfaced directly in dashboards
- Process twins that visualize multi-variable relationships
- Cross-production-run comparison and analysis
- Good for identifying root causes of quality issues
- Enterprise scalability for large, complex manufacturing operations
Limitations:
- Enterprise-only pricing ($200K+/year typical)
- Long implementation timelines (3–6 months)
- Dashboards require data science configuration for AI features
- Overkill for straightforward machine monitoring use cases
- Not a replacement for real-time operational dashboards — better for analytical dashboards
What to Look For in a Real-Time Dashboard Platform
1. Pre-Built vs. Custom Dashboards
This is the biggest decision. Pre-built dashboards (MachineCDN, MachineMetrics) get you to value in hours. Custom dashboards (Ignition, Grafana) get you exactly what you want — in weeks or months.
If your team includes developers or integrators: Custom platforms offer maximum flexibility.
If your team needs turnkey solutions: Pre-built platforms with configurable options save months.
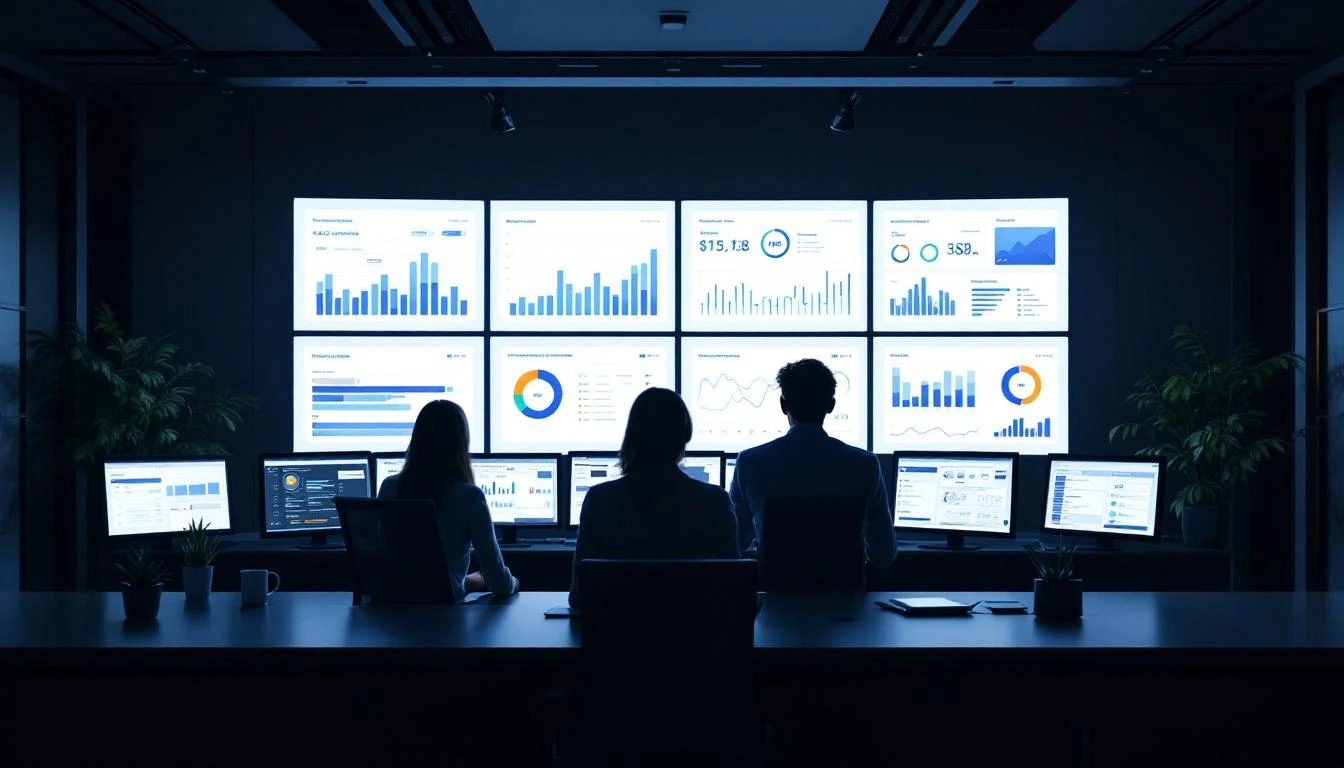
2. TV Mode / Andon Boards
Many plants mount displays on the factory floor showing real-time production data. The best platforms support:
- Full-screen TV mode (auto-rotating between views)
- Large-font, high-contrast displays for floor visibility
- Auto-refresh without manual interaction
- Department or zone-specific views
3. Mobile Responsiveness
Manufacturing leaders aren't always at their desks. Dashboards that work on phones and tablets — without a separate app install — are essential for managers who walk the floor, travel between sites, or respond to after-hours alerts.
4. Data Granularity
Can you drill down from a plant-level overview to a zone-level view to a specific machine's tag-level data? The best dashboards support hierarchical drill-down: Fleet → Plant → Zone → Machine → Tag → Historical Trend.
5. Role-Based Views
An operator needs to see their machine's status and current production target. A plant manager needs OEE across all lines. A VP of operations needs plant-to-plant comparison. The best platforms support role-based dashboard assignment so each user sees what's relevant.
Real-Time Dashboards and Manufacturing KPIs
The dashboards are only as valuable as the metrics they display. Here are the KPIs that matter most in a real-time manufacturing context:
Production KPIs:
- OEE (Overall Equipment Effectiveness)
- Parts per hour vs. target
- Cycle time actual vs. standard
- First pass yield
- Scrap rate
Equipment KPIs:
- Machine availability (% uptime)
- MTBF (Mean Time Between Failures)
- MTTR (Mean Time to Repair)
- Active alarm count and duration
- Downtime by reason code
Process KPIs:
- Temperature, pressure, flow rate (for process industries)
- Energy consumption per part/per shift
- Material usage vs. plan
- Changeover time
For a deeper dive on OEE specifically, see our guide on how to calculate OEE and the best OEE monitoring software.
Getting Started with Real-Time Dashboards
The fastest path to real-time manufacturing visibility:
- Identify 5 critical machines that impact your production most
- Check their controllers — what PLC/controller brand and model? What protocols do they support?
- Define your must-see KPIs — OEE? Cycle time? Temperature? Downtime?
- Pilot with a turnkey platform — deploy on those 5 machines and validate value before scaling
- Expand based on results — once you see the data, you'll know exactly which machines to add next
MachineCDN can get you from zero to a live real-time dashboard in a single afternoon. No hardware purchases, no IT involvement, no development work.
Want to see your factory in real time — today? Book a demo with MachineCDN. We'll connect your machines and show you live production data before the demo ends.