How to Reduce Energy Costs in Manufacturing with IIoT: A Practical Guide to Cutting 15-30% Off Your Power Bill
Energy is the expense that hides in plain sight. Most manufacturers know their monthly utility bill, but few can answer these questions:
- Which machines consume the most energy per part produced?
- How much energy does your factory waste during idle time and changeovers?
- What's the actual cost of running Machine #7 versus Machine #12 for the same product?
- How does your energy consumption compare between shifts, operators, or products?
Without machine-level energy visibility, you're paying a number you can't optimize. And that number is getting bigger — U.S. industrial electricity rates have risen 22% since 2020, and the trend isn't reversing.
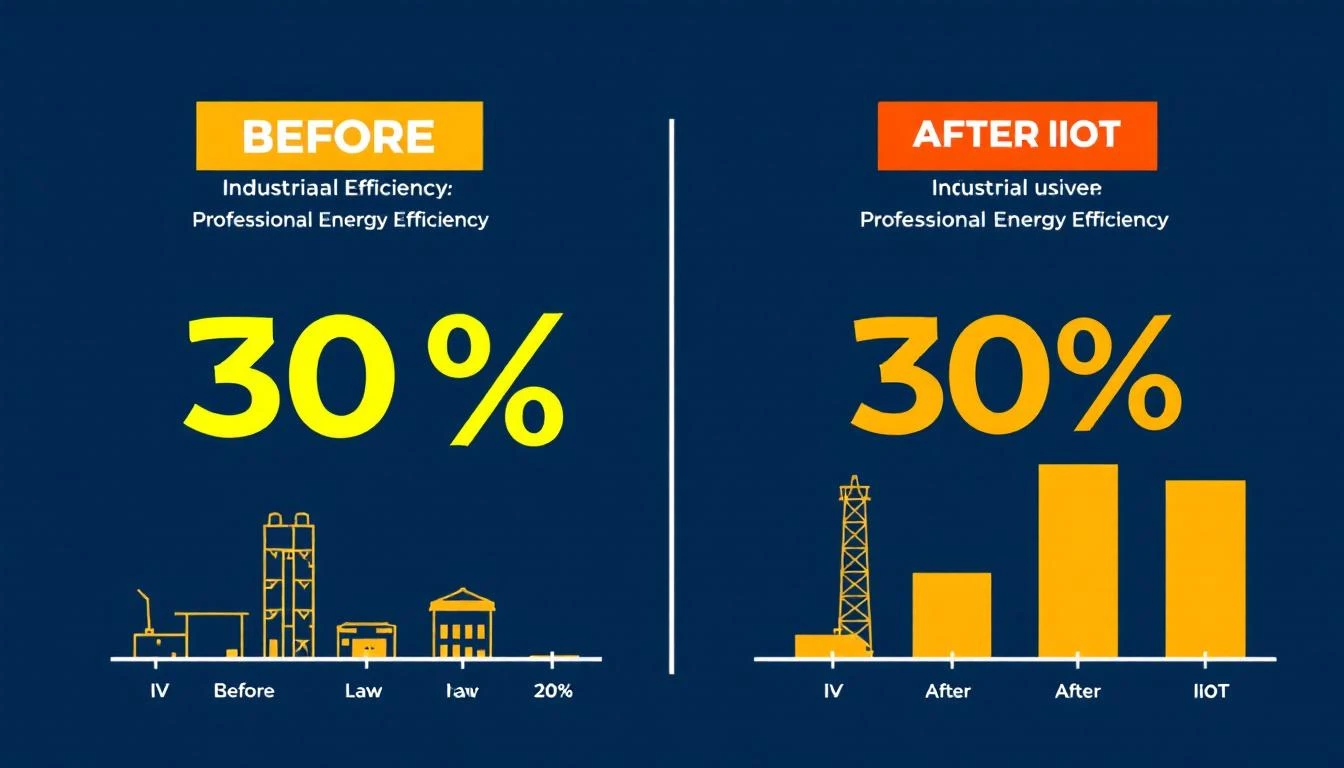
This guide shows you how to use IIoT monitoring to find and eliminate energy waste in manufacturing operations — with a realistic target of 15–30% reduction in energy costs within the first year.
The Energy Problem in Manufacturing
Manufacturing accounts for roughly 33% of total U.S. energy consumption, according to the U.S. Energy Information Administration. But within individual plants, energy management is often crude:
The typical approach:
- Receive monthly utility bill
- Compare to last month
- If it went up, blame the weather or production volume
- If it went down, take credit
- Repeat
This approach misses everything actionable. You can't optimize what you can't measure at the machine level.
What IIoT-enabled energy monitoring reveals:
- Machines that consume disproportionate energy relative to output
- Idle machines left running during breaks, changeovers, and off-shifts
- HVAC and compressed air systems operating outside efficient ranges
- Peak demand charges caused by simultaneous machine startups
- Motor degradation (increasing current draw = developing fault + higher energy costs)
Where Manufacturing Energy Goes (And Where It's Wasted)
Before optimizing, understand the typical energy breakdown in a manufacturing facility:
| Energy Consumer | Typical % of Total | Waste Opportunity |
|---|---|---|
| Motors and drives | 60–70% | High — motor efficiency, VFD optimization |
| Compressed air | 10–15% | Very high — leaks waste 20–30% of compressed air energy |
| HVAC and lighting | 10–15% | Moderate — scheduling and zoning |
| Process heating/cooling | 5–15% | Moderate — insulation, scheduling |
| Auxiliary systems | 5–10% | Low–moderate |
The biggest opportunities are in motors (running inefficient or oversized motors, lack of VFDs) and compressed air (leaks, over-pressurization, and unnecessary compressor cycling).
Step 1: Establish Machine-Level Energy Baselines
You can't reduce what you haven't measured. The first step is getting per-machine energy consumption data — and most manufacturers don't have it.
Traditional approach: Install power meters on every machine. This works but is expensive ($500–$2,000 per meter plus installation) and requires electrician labor.
IIoT approach: Many modern PLCs already monitor motor current, drive power output, and operating state. A protocol-native IIoT platform like MachineCDN can read these values directly from the PLC — no additional hardware required. The platform's built-in energy consumption monitoring tracks kWh per machine automatically.
Key baseline metrics to establish:
- kWh per machine per shift — total energy consumed during production
- kWh per part — energy cost allocated to each unit of output
- Idle energy consumption — how much energy each machine consumes while not producing
- Peak demand — highest instantaneous power draw, which drives demand charges
- Energy by state — running vs. idle vs. changeover vs. standby consumption
How long to establish baselines: 2–4 weeks of continuous monitoring captures enough data to account for product mix variation, shift differences, and seasonal factors.
Step 2: Identify the Top Energy Wasters
With baselines established, the data will immediately surface your biggest opportunities. Here are the most common findings:
Idle Machine Energy
This is almost always the biggest surprise. Manufacturers regularly discover that machines consume 30–50% of their running energy while sitting idle. Motors stay energized, hydraulic pumps circulate, cooling systems run, and compressed air valves remain pressurized — even when the machine isn't making parts.
Real-world example: A stamping press consumes 85 kW while running and 40 kW while idle. Over a typical shift with 30% idle time (changeovers, breaks, material waiting), that idle consumption costs:
- 40 kW × 2.4 hours × $0.12/kWh = $11.52 per shift in idle energy
- Across 10 presses running 2 shifts: $115,200 per year in idle energy waste
IIoT solution: Configure automatic energy-saving protocols based on machine state. When the PLC reports idle state for more than 5 minutes, trigger standby mode — drop hydraulic pressure, reduce motor speed, or shut down auxiliary systems. MachineCDN's threshold alerting can flag machines that have been idle beyond threshold, prompting operators to either start production or initiate standby.
Motor Inefficiency and Degradation
Electric motors are the workhorses of manufacturing — and the primary energy consumer. As motors age, their efficiency degrades:
- Bearing wear increases friction (2–5% efficiency loss)
- Insulation degradation increases electrical losses
- Misalignment increases mechanical losses
- Oversized motors running at partial load waste energy at low power factors
IIoT solution: Monitor motor current draw continuously. A motor drawing 10% more current than its baseline for the same work output is telling you:
- It's losing efficiency (costing you more energy per part)
- It's developing a mechanical problem (bearing wear, misalignment)
- Both — which means both cost savings AND failure prevention from the same data
This is where predictive maintenance and energy optimization converge. The same data that predicts a motor failure also identifies energy waste.
Compressed Air Leaks
Compressed air is called the "fourth utility" in manufacturing — and it's the most expensive one per unit of energy delivered. Generating compressed air is inherently inefficient (only 10–15% of input energy becomes useful work), and leaks make it worse.
Industry data: The U.S. Department of Energy estimates that a typical compressed air system loses 20–30% of its output to leaks. For a manufacturing plant spending $200K/year on compressed air energy, that's $40K–$60K lost to leaks.
IIoT solution: Monitor compressor run time, discharge pressure, and system flow rate. A compressor that runs more frequently than expected — especially during non-production hours — indicates leaks. IIoT data can also track pressure drop across zones, pinpointing where leaks are concentrated.
Peak Demand Charges
Many industrial electricity tariffs include demand charges based on your highest 15-minute average power draw during the billing period. A single spike — like starting 5 large machines simultaneously at shift start — can increase your demand charge for the entire month.
IIoT solution: Monitor aggregate power draw in real time and implement staggered startup sequences. Instead of all machines starting at 6:00 AM, stagger startups at 2-minute intervals. This spreads the demand peak and can reduce demand charges by 10–20%.
Step 3: Implement Energy Optimization Controls
With waste identified, implement systematic changes:
Automatic Standby/Sleep Modes
Configure your IIoT platform to trigger energy-saving states based on machine idle time:
- 5 minutes idle: Reduce auxiliary systems (cooling pumps to low speed, hydraulics to low pressure)
- 15 minutes idle: Drop to standby mode (motors off, systems pressurized but inactive)
- 60 minutes idle: Full sleep (everything off except PLC and monitoring)
Expected savings: 15–25% reduction in non-productive energy consumption.
Optimized Production Scheduling
Energy-aware scheduling considers machine efficiency alongside production requirements:
- Run energy-intensive operations during off-peak rate periods
- Batch similar products to minimize changeover energy
- Prioritize your most energy-efficient machines for long runs
- Schedule maintenance during peak-rate periods when production energy cost is highest
Expected savings: 5–10% reduction through schedule optimization alone.
Motor and Drive Optimization
- Install VFDs (Variable Frequency Drives) on motors that don't need full-speed operation continuously
- Right-size replacement motors when current motors fail (don't replace a 50HP motor with another 50HP if the load only needs 30HP)
- Fix alignment issues flagged by current monitoring
Expected savings: 10–20% reduction in motor energy consumption where VFDs are added.
Step 4: Track and Report Progress
Energy optimization isn't a one-time project — it's an ongoing discipline. Your IIoT platform should provide:
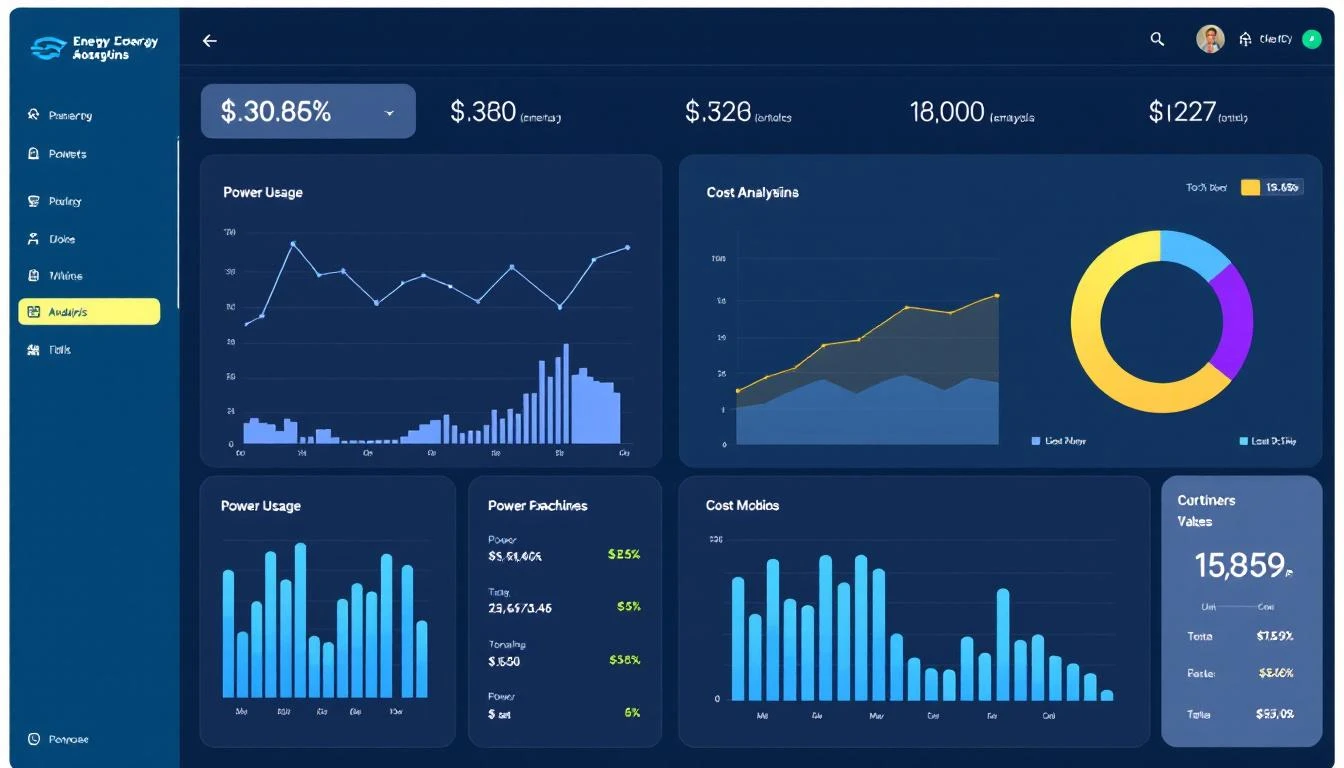
Daily energy dashboards showing:
- Total facility consumption vs. target
- Per-machine energy consumption
- kWh per unit produced (the key efficiency metric)
- Idle energy as a percentage of total
- Peak demand tracking
Weekly energy reports including:
- Week-over-week comparison
- Best and worst performing machines
- Anomalies (unexpected consumption spikes)
- Savings from implemented optimizations
Monthly energy reviews:
- Month-over-month trend
- Progress toward reduction targets
- ROI of energy optimization investments
- Identification of next-priority optimization opportunities
MachineCDN's custom report builder lets you create these energy views alongside your production and maintenance dashboards — no separate energy management platform needed.
The ESG Bonus
Energy reduction isn't just about the power bill anymore. ESG (Environmental, Social, Governance) reporting is becoming mandatory for manufacturers selling to large enterprises. Your customers are increasingly asking for:
- Carbon footprint per unit produced
- Year-over-year emission reductions
- Energy efficiency metrics and improvement plans
- Sustainability certifications and compliance
IIoT-powered energy monitoring gives you the data to answer these questions accurately — not with estimates, but with actual per-machine, per-product energy consumption data.
For manufacturers selling into regulated industries (automotive, aerospace, pharmaceuticals), energy reporting capabilities can become a competitive requirement, not just a nice-to-have.
Real-World Results: What 15–30% Reduction Looks Like
For a mid-size manufacturing facility with a $500K annual energy bill:
| Optimization Area | Estimated Savings |
|---|---|
| Idle machine energy reduction | $40K–$75K |
| Compressed air leak repair | $15K–$30K |
| Peak demand management | $10K–$25K |
| Motor/drive optimization | $20K–$40K |
| Production schedule optimization | $10K–$25K |
| Total | $95K–$195K (19%–39%) |
These numbers are conservative and based on DOE industrial assessment data. Your actual results will vary based on facility age, current efficiency level, and equipment mix.
Getting Started
The beauty of IIoT-based energy monitoring is that you don't need a separate energy management system. If you're already connecting machines to an IIoT platform for production monitoring, OEE tracking, or predictive maintenance, adding energy monitoring is often just a matter of configuring additional PLC tags.
- Start with your highest-energy machines — the top 20% of consumers typically account for 60–80% of total facility consumption
- Establish 2-week baselines — collect data before making changes
- Target idle energy first — it's the easiest win with the fastest payback
- Implement staggered startups — reduces peak demand charges with zero capital investment
- Track kWh per part — this is your efficiency metric, not total consumption
Ready to see where your energy is going? Book a demo with MachineCDN — we'll show you per-machine energy monitoring alongside production data, maintenance alerts, and OEE tracking on one platform.