Best Real-Time OEE Dashboard Software for Manufacturing in 2026
Overall Equipment Effectiveness (OEE) is the single most important metric in manufacturing. It tells you exactly how much of your planned production time is actually productive — no guessing, no gut feel. But here's the problem: most manufacturers still calculate OEE manually, using spreadsheets fed by operators writing numbers on clipboards.
Manual OEE is better than no OEE. But it's also wrong. Studies consistently show that manually tracked OEE overstates actual performance by 10-30%. Operators round up. Micro-stops don't get recorded. Shift handoff loses data. By the time anyone sees the numbers, they're hours or days old.
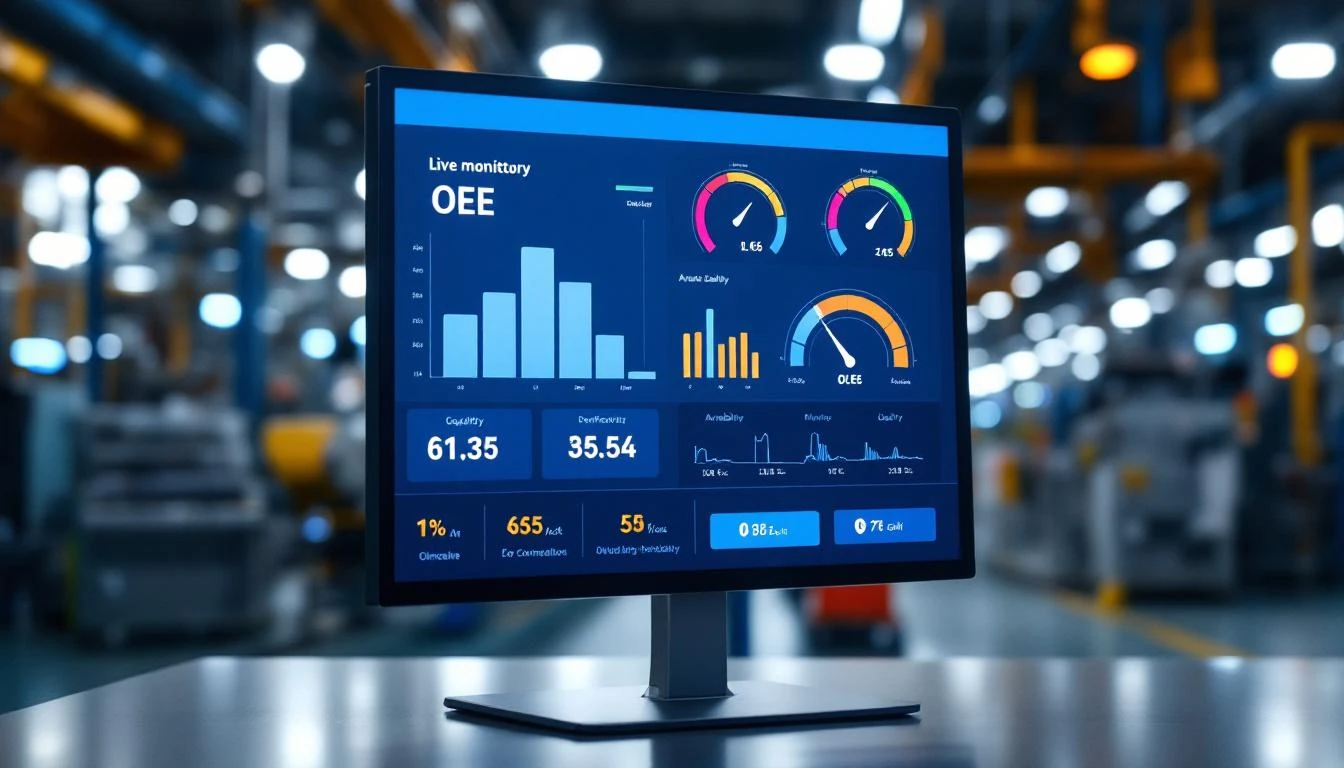
Real-time OEE dashboards solve this by pulling data directly from machines, calculating Availability, Performance, and Quality automatically, and displaying results live on the factory floor. In 2026, the technology is mature, affordable, and deployable in days — not months. Here's what to look for and which platforms deliver.

What a Real-Time OEE Dashboard Must Do
Before evaluating vendors, establish your baseline requirements. A real-time OEE dashboard must:
1. Automatic Data Collection
The dashboard must pull data directly from PLCs, sensors, or machine controllers — not from operator input. The moment a human enters data, you've introduced delay and error. Look for platforms that read machine states (running, idle, alarm) directly from the control system.
2. Live Availability Calculation
Availability = Actual Run Time / Planned Production Time. The dashboard should detect every stop — planned and unplanned — and categorize downtime automatically by reason code. Operators should only need to annotate why a stop happened, not that it happened.
3. Real-Time Performance Tracking
Performance = (Ideal Cycle Time × Total Count) / Run Time. The system should know ideal cycle times per product/recipe and automatically flag slow cycles. Performance losses from micro-stops (sub-5-minute events that operators never record) are where most plants hemorrhage productivity.
4. Automatic Quality Tracking
Quality = Good Count / Total Count. At minimum, the dashboard should track total production counts. Ideally, it integrates with quality inspection data (SPC, vision systems, or manual reject counts) to calculate first-pass yield in real time.
5. Drill-Down Capability
An OEE number alone is useless. You need to drill from plant → line → machine → shift → hour to find where losses occur. The best dashboards let you decompose OEE into its six big losses (breakdowns, setup/adjustments, idling/minor stops, reduced speed, defects, and startup yield loss).
6. Historical Trending
Real-time is essential for immediate response. Historical trending is essential for continuous improvement. Look for platforms that store time-series data at granular resolution (minute-level minimum) and provide trend analysis over weeks, months, and quarters.
Top Real-Time OEE Dashboard Platforms in 2026
1. MachineCDN
Best for: Discrete manufacturers wanting fast deployment and multi-plant visibility
MachineCDN provides real-time OEE dashboards as part of its end-to-end IIoT platform. What sets it apart:
- 3-minute device setup — plug the edge device into your PLC, OEE tracking starts immediately
- Automatic state detection — reads machine running/idle/alarm states directly from the PLC
- Zero IT involvement — cellular connectivity bypasses the plant network
- Multi-plant fleet management — compare OEE across locations from a single dashboard
- Downtime categorization — automatic stop detection with operator annotation for root cause
- Threshold alerts — get notified when OEE drops below target for any machine or line
- 5-week ROI — not a typo
Ideal for: Injection molding, CNC machining, stamping, packaging, assembly, extrusion
2. MachineMetrics
Best for: CNC-heavy job shops
MachineMetrics specializes in CNC machine monitoring and does it well. Their OEE dashboards are focused on machining operations:
- Strong CNC protocol support (MTConnect, Fanuc FOCAS)
- Shop floor display mode with andon-style alerts
- Part counting via adapter integration
- Utilization-focused metrics
Limitations: Primarily CNC-focused. If your plant has mixed equipment (injection molding, packaging, assembly), MachineMetrics' scope is narrower than a general-purpose IIoT platform.
3. Sight Machine
Best for: High-volume continuous/batch manufacturing with data science teams
Sight Machine provides manufacturing analytics with AI-driven root cause analysis:
- Process parametric analysis across multiple variables
- AI models for quality prediction
- Data lake architecture for complex queries
- Strong automotive and consumer goods presence
Limitations: Expensive, complex to deploy, requires data engineering resources. Not a "plug and play" OEE solution.
4. Litmus Edge
Best for: Large enterprises wanting edge-native analytics
Litmus provides edge computing with built-in analytics capabilities:
- 200+ industrial protocol drivers
- Edge-native analytics (process data before cloud)
- Kubernetes-based edge orchestration
Limitations: High cost and implementation complexity. Enterprise-focused — not practical for mid-market manufacturers.
5. Tulip
Best for: Manual/semi-automated operations where operators are the primary data source
Tulip takes a no-code approach to manufacturing apps:
- Drag-and-drop OEE app builder
- IoT gateway for machine connectivity
- Strong for human-centric processes (assembly, inspection)
Limitations: OEE accuracy depends on operator interaction. For fully automated lines, purpose-built IIoT platforms provide more reliable automated data collection.
How to Evaluate OEE Dashboard Software
Data Accuracy Test
Ask each vendor: "How do you detect machine stops shorter than 2 minutes?" Micro-stops are the #1 hidden OEE loss. If the platform polls machine state every 30 seconds, it misses stops shorter than 30 seconds. Look for sub-second polling or event-driven detection.
Deployment Speed Test
Ask: "How long from contract signature to live OEE data on the first machine?" If the answer is "6-8 weeks for implementation," that's a red flag. Modern platforms like MachineCDN can show live OEE within minutes of physical installation.
Multi-Machine Test
Ask: "Show me OEE across 5 different machine types in a single view." Many platforms handle homogeneous environments well but struggle with mixed equipment. Your plastics plant might have injection molding, extrusion, CNC for mold making, and packaging — your OEE platform needs to handle all of them.
Offline Resilience Test
Ask: "What happens if cloud connectivity drops for 4 hours?" Edge buffering is non-negotiable. If the platform loses data during internet outages, your OEE numbers become unreliable. MachineCDN's edge device buffers data locally and syncs when connectivity returns.
Shift Handoff Test
Ask: "How does OEE data flow between shifts?" Shift transitions are where data falls through the cracks. The best platforms maintain continuous OEE tracking across shifts with automatic shift-based reporting and comparison.
OEE Benchmarks by Industry
Where does your plant stand? Here are typical OEE ranges by industry (McKinsey, Aberdeen, Gartner data):
| Industry | World Class | Average | Below Average |
|---|---|---|---|
| Automotive | 90%+ | 75-85% | Below 70% |
| Pharmaceuticals | 85%+ | 65-75% | Below 55% |
| Food & Beverage | 85%+ | 60-75% | Below 50% |
| Packaging | 80%+ | 55-70% | Below 45% |
| Plastics/Injection Molding | 85%+ | 65-80% | Below 55% |
| Metals/Stamping | 85%+ | 60-75% | Below 50% |
| General Manufacturing | 85%+ | 60-75% | Below 50% |
The typical manufacturer starts at 40-60% OEE when they first deploy real-time measurement. Why? Because manual tracking was hiding 15-25% of actual losses. That's not a failure — it's an opportunity. Every percentage point of OEE improvement is worth $10,000–$50,000 per machine per year in recovered capacity.
Implementation Best Practices
Start with One Line
Don't try to instrument the entire plant at once. Pick your bottleneck line — the one where OEE improvement directly translates to more throughput — and prove the value.
Define Standard Downtime Reason Codes
Before deploying, agree on a standardized list of downtime reason codes. Keep it to 10-15 categories maximum. Too many codes create analysis paralysis. Too few create "other" buckets that hide information.
Set Realistic Targets
Don't target 85% OEE on day one. If your current measured OEE is 55%, target 65% in the first quarter. Sustainable improvement comes from consistent small gains, not moonshot targets.
Display OEE on the Floor
Install screens showing live OEE at the line level. Visibility drives behavior. When operators can see their performance in real time, they respond to slowdowns and stops faster.
Review Weekly, Not Monthly
Monthly OEE reviews are too slow for continuous improvement. Hold 15-minute weekly reviews per line, focusing on top 3 downtime reasons and one specific improvement action.
The Cost of Not Having Real-Time OEE
Consider a 10-machine plant running two shifts:
- Average OEE without real-time tracking: 55% (manual clipboard data says 72%, but it's wrong)
- Average OEE with real-time tracking + 6 months of improvement: 68%
- OEE improvement: 13 percentage points
- Revenue per machine per year: $500,000
- Value of 13% OEE improvement: $650,000/year
Against a platform cost of $10,000–$50,000/year, the ROI is 13x–65x in the first year alone. This isn't theoretical. It's what manufacturers consistently report when they move from manual to automated OEE tracking.
Conclusion
Real-time OEE dashboards are no longer a "nice to have" — they're table stakes for any manufacturer serious about competitiveness. The technology has matured to the point where 3-minute setup, cellular connectivity, and AI-powered analytics are available at a fraction of what enterprise platforms cost.
If your plant is still running on spreadsheets and clipboards, you're flying blind — and your competitors aren't.
Book a demo with MachineCDN to see real-time OEE dashboards running on your equipment in minutes, not months.