
18 posts tagged with "edge-gateway"

View All Tags

Allen-Bradley Micro800 EtherNet/IP Integration: A Practical Guide for Edge Connectivity [2026]

· 11 min read

Allen-Bradley Micro800 EtherNet/IP Edge Connectivity

The Allen-Bradley Micro800 series — particularly the Micro820, Micro830, and Micro850 — occupies a sweet spot in industrial automation. These compact PLCs deliver enough processing power for standalone machines while speaking EtherNet/IP natively. But connecting them to modern IIoT edge gateways reveals subtleties that trip up even experienced automation engineers.

This guide covers what you actually need to know: how CIP tag-based addressing works on Micro800s, how to configure element sizes and counts correctly, how to handle different data types, and how to avoid the pitfalls that turn a simple connectivity project into a week-long debugging session.

Modbus RTU Serial Link Diagnostics: Timeout Tuning, Error Recovery, and Fieldbus Troubleshooting [2026]

· 12 min read

If you've ever stared at a Modbus RTU link that mostly works — dropping one request out of fifty, returning CRC errors at 2 AM, or silently losing a slave device after a power blip — you know that "mostly works" is the most dangerous state in industrial automation.

Modbus TCP gets all the attention in modern IIoT discussions, but the factory floor still runs on RS-485 serial. Chillers, temperature controllers, VFDs, auxiliary equipment — an enormous installed base of devices still speaks Modbus RTU over twisted-pair wiring. Getting that serial link right is the difference between a monitoring system that earns trust and one that gets unplugged.

This guide covers the diagnostic techniques and configuration strategies that separate a bulletproof Modbus RTU deployment from a frustrating one.

Modbus TCP Gateway Failover: Building Redundant PLC Communication for Manufacturing [2026]

· 14 min read

Modbus TCP gateway failover architecture

Modbus TCP remains the most widely deployed industrial protocol in manufacturing. Despite being a 1979 design extended to Ethernet in 1999, its simplicity — request/response over TCP, 16-bit registers, four function codes that cover 90% of use cases — makes it the lowest common denominator that virtually every PLC, VFD, and sensor hub supports.

But simplicity has a cost: Modbus TCP has zero built-in redundancy. No heartbeats. No automatic reconnection. No session recovery. When the TCP connection drops — and in a factory environment with electrical noise, cable vibrations, and switch reboots, it will drop — your data collection goes dark until someone manually restarts the gateway or the application logic handles recovery.

This guide covers the architecture patterns for building resilient Modbus TCP gateways that maintain data continuity through link failures, PLC reboots, and network partitions.

Understanding Why Modbus TCP Connections Fail

Before designing failover, you need to understand the failure modes. In a year of operating Modbus TCP gateways across manufacturing floors, you'll encounter all of these:

Failure Mode 1: TCP Connection Reset (ECONNRESET)

The PLC or an intermediate switch drops the TCP connection. Common causes:

  • PLC firmware update or watchdog reboot
  • Switch port flap (cable vibration, loose connector)
  • PLC connection limit exceeded (most support 6-16 simultaneous TCP connections)
  • Network switch spanning tree reconvergence (can take 30-50 seconds on older managed switches)

Detection time: Immediate — the next modbus_read_registers() call returns ECONNRESET.

Failure Mode 2: Connection Timeout (ETIMEDOUT)

The PLC stops responding but doesn't close the connection. The TCP socket remains open, but reads time out. Common causes:

  • PLC CPU overloaded (complex ladder logic consuming all scan cycles)
  • Network congestion (broadcast storms, misconfigured VLANs)
  • IP conflict (another device grabbed the PLC's address)
  • PLC in STOP mode (program halted, communication stack still partially active)

Detection time: Your configured response timeout (typically 500ms-2s) per read operation. For a 100-tag poll cycle, a full timeout can mean 50-200 seconds of dead time before you confirm the link is down.

Failure Mode 3: Connection Refused (ECONNREFUSED)

The PLC's TCP stack is active but Modbus is not. Common causes:

  • PLC in bootloader mode after firmware flash
  • Modbus TCP server disabled in PLC configuration
  • Firewall rule change on managed switch blocking port 502

Detection time: Immediate on the next connection attempt.

Failure Mode 4: Silent Failure (EPIPE/EBADF)

The connection appears open from the gateway's perspective, but the PLC has already closed it. The first write or read on a stale socket triggers EPIPE or EBADF. This happens when:

  • PLC reboots cleanly but the gateway missed the FIN packet (common with UDP-accelerated switches)
  • OS socket cleanup runs asynchronously

Detection time: Only on the next read/write attempt — could be seconds to minutes if polling intervals are long.

The Connection Recovery State Machine

A resilient Modbus TCP gateway implements a state machine with five states:

                    ┌─────────────┐
│ CONNECTING │
│ (backoff) │
└──────┬──────┘
│ modbus_connect() success
┌──────▼──────┐
┌─────│ CONNECTED │─────┐
│ │ (polling) │ │
│ └──────┬──────┘ │
│ │ │
timeout/error link_state=1 read error
│ │ │
┌────────▼───┐ ┌─────▼─────┐ ┌──▼──────────┐
│ RECONNECT │ │ READING │ │ LINK_DOWN │
│ (flush + │ │ (normal) │ │ (notify + │
│ close) │ │ │ │ reconnect) │
└────────┬───┘ └───────────┘ └──┬──────────┘
│ │
└────────────────────────┘
close + backoff

Key Implementation Details

1. Always close before reconnecting. A stale Modbus context will leak file descriptors and eventually exhaust the OS socket table. When any error occurs in the ETIMEDOUT/ECONNRESET/EPIPE/EBADF family, the correct sequence is:

modbus_flush(context)   → drain pending data
modbus_close(context) → close the TCP socket
sleep(backoff_ms) → prevent reconnection storms
modbus_connect(context) → establish new connection

Never call modbus_connect() on a context that hasn't been closed first. The libmodbus library doesn't handle this gracefully — you'll get zombie sockets.

2. Implement exponential backoff with a ceiling. After a connection failure, don't retry immediately — the PLC may be rebooting and needs time. A practical backoff schedule:

AttemptDelayCumulative Time
11 second1s
22 seconds3s
34 seconds7s
48 seconds15s
5+10 seconds (ceiling)25s+

The 10-second ceiling is important — you don't want the backoff growing to minutes. PLC reboots typically complete in 15-45 seconds. A 10-second retry interval means you'll reconnect within one retry cycle after the PLC comes back.

3. Flush serial buffers for Modbus RTU. If your gateway also supports Modbus RTU (serial), always call modbus_flush() before reading after a reconnection. Serial buffers can contain stale response fragments from before the disconnection, and these will corrupt the first read's response parsing.

4. Track link state as a first-class data point. Don't just log connection status — deliver it to the cloud alongside your tag data. A special "link state" tag (boolean: 0 = disconnected, 1 = connected) transmitted immediately (not batched) gives operators real-time visibility into gateway health. When the link transitions from 1→0, send a notification. When it transitions from 0→1, force-read all tags to establish current values.

Register Grouping: Minimizing Round Trips

Modbus TCP's request/response model means each read operation incurs a full TCP round trip (~0.5-5ms on a local network, 50-200ms over cellular). Reading 100 individual registers one at a time takes 100 round trips — potentially 500ms on a good day.

The optimization is contiguous register grouping — instead of reading registers one at a time, read blocks of contiguous registers in a single request.

The Grouping Algorithm

Given a sorted list of register addresses to read, the gateway walks through them and groups contiguous registers that meet three criteria:

  1. Same function code — you can't mix input registers (FC 4, 3xxxxx) with holding registers (FC 3, 4xxxxx) in one request
  2. Contiguous addresses — register N+1 immediately follows register N (with appropriate gaps filled)
  3. Same polling interval — don't group a 1-second alarm tag with a 60-second temperature tag
  4. Maximum register count ≤ 50 — while Modbus allows up to 125 registers per read, keeping requests under 50 registers (~100 bytes) prevents fragmentation issues on constrained networks and limits the blast radius of a single failed read

Example: Optimized vs Naive Polling

Consider a chiller with 10 compressor circuits, each reporting 16 process variables:

Naive approach: 160 individual reads = 160 round trips

Read register 300003 → 1 register  (CQT1 Condenser Inlet Temp)
Read register 300004 → 1 register (CQT1 Approach Temp)
Read register 300005 → 1 register (CQT1 Chill In Temp)
...
Read register 300016 → 1 register (CQT1 Superheat Temp)

Grouped approach: Registers 300003-300018 are contiguous, same function code (FC 4), same interval (60s)

Read registers 300003 → 16 registers (all CQT1 process data in ONE request)
Read registers 300350 → 16 registers (all CQT2 process data in ONE request)
...

Result: 160 round trips → 10 round trips. On a 2ms RTT network, that's 320ms → 20ms.

Handling Non-Contiguous Gaps

Real PLC register maps aren't perfectly contiguous. The chiller above has CQT1 data at registers 300003-300018 and CQT2 data starting at 300350 — a gap of 332 registers. Don't try to read 300003-300695 in one request to "fill the gap" — you'll read hundreds of irrelevant registers and waste bandwidth.

Instead, break at non-contiguous boundaries:

Group 1: 300003-300018  (16 registers, CQT1 process data)
Group 2: 300022-300023 (2 registers, CQT1 alarm bits)
Group 3: 300038-300043 (6 registers, CQT1 expansion + version)
Group 4: 300193-300194 (2 registers, CQT1 status words)
Group 5: 300260-300278 (19 registers, CQT2-10 alarm bits)
Group 6: 300350-300366 (17 registers, CQT2-3 temperatures)
...

The 50ms Inter-Read Delay

Between consecutive Modbus read requests, insert a 50ms delay. This sounds counterintuitive — why slow down? — but it serves two purposes:

  1. PLC scan cycle breathing room. Many PLCs process Modbus requests in their communication interrupt, which competes with the main scan cycle. Rapid-fire requests can extend the scan cycle, triggering watchdog timeouts on safety-critical programs.

  2. TCP congestion avoidance. On constrained networks (especially cellular gateways), bursting 50 reads in 100ms can overflow buffers. The 50ms spacing distributes the load evenly.

Dual-Path Failover Architecture

For mission-critical data collection (pharmaceutical batch records, automotive quality traceability), a single gateway represents a single point of failure. The dual-path architecture uses two independent gateways polling the same PLC:

Architecture

                    ┌──────────┐
│ PLC │
│ (Modbus) │
└──┬───┬──┘
│ │
Port 502 │ │ Port 502
│ │
┌────────▼┐ ┌▼────────┐
│Gateway A│ │Gateway B│
│(Primary)│ │(Standby)│
└────┬────┘ └────┬────┘
│ │
▼ ▼
┌────────────────────┐
│ MQTT Broker │
│ (cloud/edge) │
└────────────────────┘

Active/Standby vs Active/Active

Active/Standby: Gateway A polls the PLC. Gateway B monitors A's heartbeat (via MQTT LWT or a shared health topic). If A goes silent for >30 seconds, B starts polling. When A recovers, it checks B's status and either resumes as primary or remains standby.

  • Pro: Only one gateway reads from the PLC, respecting the PLC's connection limit
  • Con: 30-second failover gap

Active/Active: Both gateways poll the PLC simultaneously. The cloud platform deduplicates data based on timestamps and device serial numbers. If one gateway fails, the other's data is already flowing.

  • Pro: Zero-downtime failover, no coordination needed
  • Con: Doubles PLC connection count and network traffic. Most PLCs support this (6-16 connections), but verify.

Recommendation: Active/Active with cloud-side deduplication. The PLC connection overhead is negligible compared to the operational cost of a 30-second data gap. Cloud-side deduplication is trivial — tag ID + timestamp + device serial number provides a natural composite key.

Store-and-Forward: Surviving Cloud Disconnections

Gateway-to-PLC failover handles half the problem. The other half is cloud connectivity — cellular links drop, VPN tunnels restart, and MQTT brokers undergo maintenance. During these outages, the gateway must buffer data locally and forward it when connectivity returns.

The Paged Ring Buffer

A production-grade store-and-forward buffer uses a paged ring buffer — pre-allocated memory divided into fixed-size pages, with separate write and read pointers:

┌──────────┐
│ Page 0 │ ← read_pointer (next to transmit)
│ [data] │
├──────────┤
│ Page 1 │
│ [data] │
├──────────┤
│ Page 2 │ ← write_pointer (next to fill)
│ [empty] │
├──────────┤
│ Page 3 │
│ [empty] │
└──────────┘

When the MQTT connection is healthy:

  1. Tag data is written to the current work page
  2. When the page fills, it moves to the "used" queue
  3. The buffer transmits the oldest used page to MQTT (QoS 1 for delivery confirmation)
  4. On publish acknowledgment, the page moves to the "free" queue

When the MQTT connection drops:

  1. Tag data continues writing to pages (the PLC doesn't stop producing data)
  2. Used pages accumulate in the queue
  3. If the queue fills, the oldest used page is recycled as a work page — accepting data loss of the oldest data to preserve the newest

This design guarantees:

  • Constant memory usage — no dynamic allocation on an embedded device
  • Graceful degradation — oldest data is sacrificed first
  • Thread safety — mutex-protected page transitions prevent race conditions between the reading thread (PLC poller) and writing thread (MQTT publisher)

Sizing the Buffer

Buffer size depends on your data rate and expected maximum outage duration:

buffer_size = data_rate_bytes_per_second × max_outage_seconds × 1.2 (overhead)

For a typical deployment:

  • 100 tags × 4 bytes/value = 400 bytes per poll cycle
  • 1 poll per second = 400 bytes/second
  • Binary encoding with batch overhead: ~500 bytes/second
  • Target 4 hours of offline buffering: 500 × 14,400 = 7.2MB

With 512KB pages, that's ~14 pages. Allocate 16 pages (minimum 3 needed for operation: one writing, one transmitting, one free) for an 8MB buffer.

Binary vs JSON Encoding for Buffered Data

JSON is wasteful for buffered data. The same 100-tag reading:

  • JSON: {"groups":[{"ts":1709500800,"device_type":1018,"serial_number":23456,"values":[{"id":1,"values":[245]},{"id":2,"values":[312]},...]}]} → ~2KB
  • Binary: Header (0xF7 + group count + timestamp + device info) + packed tag values → ~500 bytes

Binary encoding uses a compact format:

[0xF7] [num_groups:4] [timestamp:4] [device_type:2] [serial_num:4] 
[num_values:4] [tag_id:2] [status:1] [value_count:1] [value_size:1] [values...]

Over a cellular connection billing at $5/GB, the 4× bandwidth savings of binary encoding pays for itself within days on a busy gateway.

Alarm Tag Priority: Batched vs Immediate Delivery

Not all tags are created equal. A temperature reading that's 0.1°C different from the last poll can wait for the next batch. An alarm bit that just flipped from 0 to 1 cannot.

The gateway should support two delivery modes per tag:

Batched Delivery (Default)

Tags are accumulated in the batch buffer and delivered on the batch timeout (typically 5-30 seconds) or batch size limit (typically 10-500KB). This is efficient for process variables that change slowly.

Configuration:

{
"name": "Tank Temperature",
"id": 1,
"addr": 300202,
"type": "int16",
"interval": 60,
"compare": false
}

Immediate Delivery (do_not_batch)

Tags bypass the batch buffer entirely. When the value changes, a single-value batch is created, serialized, and pushed to the output buffer immediately. This is essential for:

  • Alarm words — operators need sub-second alarm notification
  • Machine state transitions — running/stopped/faulted changes trigger downstream actions
  • Safety interlocks — any safety-relevant state change must be delivered without batching delay

Configuration:

{
"name": "CQT 1 Alarm Bits 1",
"id": 163,
"addr": 300022,
"type": "uint16",
"interval": 1,
"compare": true,
"do_not_batch": true
}

The compare: true flag is critical for immediate-delivery tags — without it, the gateway would transmit on every read cycle (every 1 second), flooding the network. With comparison enabled, the gateway only transmits when the alarm word actually changes — zero bandwidth during normal operation, instant delivery when an alarm fires.

Calculated Tags: Extracting Bit-Level Alarms from PLC Words

Many PLCs pack multiple alarm states into a single 16-bit register. Bit 0 might indicate "high temperature," bit 1 "low flow," bit 2 "compressor fault," etc. Rather than requiring the cloud platform to perform bitwise decoding, a production gateway extracts individual bits and delivers them as separate boolean tags.

The extraction uses shift-and-mask arithmetic:

alarm_word = 0xA5 = 10100101 in binary

bit_0 = (alarm_word >> 0) & 0x01 = 1 → "High Temperature" = TRUE
bit_1 = (alarm_word >> 1) & 0x01 = 0 → "Low Flow" = FALSE
bit_2 = (alarm_word >> 2) & 0x01 = 1 → "Compressor Fault" = TRUE
...

These calculated tags are defined as children of the parent alarm word. When the parent tag changes value (detected by the compare flag), all child calculated tags are re-evaluated and delivered. If the parent doesn't change, no child processing occurs — zero CPU overhead during steady state.

This architecture keeps the PLC configuration simple (one alarm word per circuit) while giving cloud consumers individual, addressable alarm signals.

Putting It All Together: A Production Gateway Checklist

Before deploying a Modbus TCP gateway to production, verify:

  • Connection recovery handles all five error codes (ETIMEDOUT, ECONNRESET, ECONNREFUSED, EPIPE, EBADF)
  • Exponential backoff with 10-second ceiling prevents reconnection storms
  • Link state is delivered as a first-class tag (not just logged)
  • Register grouping batches contiguous same-function-code registers (max 50 per read)
  • 50ms inter-read delay protects PLC scan cycle integrity
  • Store-and-forward buffer sized for target offline duration
  • Binary encoding used for buffered data (not JSON)
  • Alarm tags configured with compare: true and immediate delivery
  • Calculated tags extract individual bits from alarm words
  • Force-read on reconnection ensures fresh values after any link recovery
  • Hourly full re-read resets all "read once" flags to catch any drift

machineCDN and Modbus TCP

machineCDN's edge gateway implements these patterns natively — connection state management, contiguous register grouping, binary batch encoding, paged ring buffers, and calculated alarm tags — so that plant engineers can focus on which tags to monitor rather than how to keep the data flowing. The gateway's JSON-based tag configuration maps directly to the PLC's register map, and the dual-format delivery system (binary for efficiency, JSON for interoperability) adapts to whatever network path is available.

For manufacturing teams running Modbus TCP equipment — from chillers and dryers to injection molding machines and conveying systems — getting the gateway layer right is the difference between a monitoring system that works in the lab and one that survives a year on the factory floor.


Building a Modbus TCP monitoring system? machineCDN handles protocol translation, buffering, and cloud delivery for manufacturing equipment — so your data keeps flowing even when your network doesn't.

Periodic Tag Reset and Forced Reads: Ensuring Data Freshness in Long-Running IIoT Gateways [2026]

· 11 min read

Periodic Tag Reset and Data Freshness in IIoT

Here's a scenario every IIoT engineer has encountered: your edge gateway has been running flawlessly for 72 hours. Dashboards look great. Then maintenance swaps a temperature sensor on a machine, and the new sensor reads 5°C higher than the old one. Your gateway, using change-of-value detection, duly reports the new temperature. But what about the 47 other tags on that machine that haven't changed? Are they still accurate, or has the PLC rebooted during the sensor swap and your cached "last known values" are now stale?

This is the data freshness problem, and it's one of the most overlooked failure modes in industrial IoT deployments. The solution involves periodic tag resets and forced reads — a pattern that sounds simple but requires careful engineering to implement correctly.

Edge Gateway Hot-Reload and Watchdog Patterns for Industrial IoT [2026]

· 12 min read

Here's a scenario every IIoT engineer dreads: it's 2 AM on a Saturday, your edge gateway in a plastics manufacturing plant has lost its MQTT connection to the cloud, and nobody notices until Monday morning. Forty-eight hours of production data — temperatures, pressures, cycle counts, alarms — gone. The maintenance team wanted to correlate a quality defect with process data from Saturday afternoon. They can't.

This is a reliability problem, and it's solvable. The patterns that separate a production-grade edge gateway from a prototype are: configuration hot-reload (change settings without restarting), connection watchdogs (detect and recover from silent failures), and graceful resource management (handle reconnections without memory leaks).

This guide covers the architecture behind each of these patterns, with practical design decisions drawn from real industrial deployments.

Edge gateway hot-reload and firmware patterns

The Problem: Why Edge Gateways Fail Silently

Industrial edge gateways operate in hostile environments: temperature swings, electrical noise, intermittent network connectivity, and 24/7 uptime requirements. The failure modes are rarely dramatic — they're insidious:

  • MQTT connection drops silently. The broker stops responding, but the client library doesn't fire a disconnect callback because the TCP connection is still half-open.
  • Configuration drift. An engineer updates tag definitions on the management server, but the gateway is still running the old configuration.
  • Memory exhaustion. Each reconnection allocates new buffers without properly freeing the old ones. After enough reconnections, the gateway runs out of memory and crashes.
  • PLC link flapping. The PLC reboots or loses power briefly. The gateway keeps polling, getting errors, but never properly re-detects or reconnects.

Solving these requires three interlocking systems: hot-reload for configuration, watchdogs for connections, and disciplined resource management.

Pattern 1: Configuration File Hot-Reload

The simplest and most robust approach to configuration hot-reload is file-based with stat polling. The gateway periodically checks if its configuration file has been modified (using the file's modification timestamp), and if so, reloads and applies the new configuration.

Design: stat() Polling vs. inotify

You have two options for detecting file changes:

stat() polling — Check the file's st_mtime on every main loop iteration:

on_each_cycle():
current_stat = stat(config_file)
if current_stat.mtime != last_known_mtime:
reload_configuration()
last_known_mtime = current_stat.mtime

inotify (Linux) — Register for kernel-level file change notifications:

fd = inotify_add_watch(config_file, IN_MODIFY)
poll(fd) // blocks until file changes
reload_configuration()

For industrial edge gateways, stat() polling wins. Here's why:

  1. It's simpler. No file descriptor management, no edge cases with inotify watches being silently dropped.
  2. It works across filesystems. inotify doesn't work on NFS, CIFS, or some embedded filesystems. stat() works everywhere.
  3. The cost is negligible. A single stat() call takes ~1 microsecond. Even at 1 Hz, it's invisible.
  4. It naturally integrates with the main loop. Industrial gateways already run a polling loop for PLC reads. Adding a stat() check is one line.

Graceful Reload: The Teardown-Rebuild Cycle

When a configuration change is detected, the gateway must:

  1. Stop active PLC connections. For EtherNet/IP, destroy all tag handles. For Modbus, close the serial port or TCP connection.
  2. Free allocated memory. Tag definitions, batch buffers, connection contexts — all of it.
  3. Re-read and validate the new configuration.
  4. Re-detect the PLC and re-establish connections with the new tag map.
  5. Resume data collection with a forced initial read of all tags.

The critical detail is step 2. Industrial gateways often use a pool allocator instead of individual malloc/free calls. All configuration-related memory is allocated from a single large buffer. On reload, you simply reset the allocator's pointer to the beginning of the buffer:

// Pseudo-code: pool allocator reset
config_memory.write_pointer = config_memory.base_address
config_memory.used_bytes = 0
config_memory.free_bytes = config_memory.total_size

This eliminates the risk of memory leaks during reconfiguration. No matter how many times you reload, memory usage stays constant.

Multi-File Configuration

Production gateways often have multiple configuration files:

  • Daemon config — Network settings, serial port parameters, batch sizes, timeouts
  • Device configs — Per-device-type tag maps (one JSON file per machine model)
  • Connection config — MQTT broker address, TLS certificates, authentication tokens

Each file should be watched independently. If only the daemon config changes (e.g., someone adjusts the batch timeout), you don't need to re-detect the PLC — just update the runtime parameter. If a device config changes (e.g., someone adds a new tag), you need to rebuild the tag chain.

A practical approach: when the daemon config changes, set a flag to force a status report on the next MQTT cycle. When a device config changes, trigger a full teardown-rebuild of that device's tag chain.

Pattern 2: Connection Watchdogs

The most dangerous failure mode in MQTT-based telemetry is the silent disconnect. The TCP connection appears alive (no RST received), but the broker has stopped processing messages. The client's publish calls succeed (they're just writing to a local socket buffer), but data never reaches the cloud.

The MQTT Delivery Confirmation Watchdog

The robust solution uses MQTT QoS 1 delivery confirmations as a heartbeat:

// Track the timestamp of the last confirmed delivery
last_delivery_timestamp = 0

on_publish_confirmed(packet_id):
last_delivery_timestamp = now()

on_watchdog_check(): // runs every N seconds
if last_delivery_timestamp == 0:
return // no data sent yet, nothing to check

elapsed = now() - last_delivery_timestamp
if elapsed > WATCHDOG_TIMEOUT:
trigger_reconnect()

With MQTT QoS 1, the broker sends a PUBACK for every published message. If you haven't received a PUBACK in, say, 120 seconds, but you've been publishing data, something is wrong.

The key insight is that you're not watching the connection state — you're watching the delivery pipeline. A connection can appear healthy (no disconnect callback fired) while the delivery pipeline is stalled.

Reconnection Strategy: Async with Backoff

When the watchdog triggers, the reconnection must be:

  1. Asynchronous — Don't block the PLC polling loop. Data collection should continue even while MQTT is reconnecting. Collected data gets buffered locally.
  2. Non-destructive — The MQTT loop thread must be stopped before destroying the client. Stopping the loop with force=true ensures no callbacks fire during teardown.
  3. Complete — Disconnect, destroy the client, reinitialize the library, create a new client, set callbacks, start the loop, then connect. Half-measures (just calling reconnect) often leave stale state.

A dedicated reconnection thread works well:

reconnect_thread():
while true:
wait_for_signal() // semaphore blocks until watchdog triggers

log("Starting MQTT reconnection")
stop_mqtt_loop(force=true)
disconnect()
destroy_client()
cleanup_library()

// Re-initialize from scratch
init_library()
create_client(device_id)
set_credentials(username, password)
set_tls(certificate_path)
set_protocol(MQTT_3_1_1)
set_callbacks(on_connect, on_disconnect, on_message, on_publish)
start_loop()
set_reconnect_delay(5, 5, no_exponential)
connect_async(host, port, keepalive=60)

signal_complete() // release semaphore

Why a separate thread? The connect_async call can block for up to 60 seconds on DNS resolution or TCP handshake. If this runs on the main thread, PLC polling stops. Industrial processes don't wait for your network issues.

PLC Connection Watchdog

MQTT isn't the only connection that needs watching. PLC connections — both EtherNet/IP and Modbus TCP — can also fail silently.

For Modbus TCP, the watchdog logic is simpler because each read returns an explicit error code:

on_modbus_read_error(error_code):
if error_code in [ETIMEDOUT, ECONNRESET, ECONNREFUSED, EPIPE, EBADF]:
close_modbus_connection()
set_link_state(DOWN)
// Will reconnect on next polling cycle

For EtherNet/IP via libraries like libplctag, a return code of -32 (connection failed) should trigger:

  1. Setting the link state to DOWN
  2. Destroying the tag handles
  3. Attempting re-detection on the next cycle

A critical detail: track consecutive errors, not individual ones. A single timeout might be a transient hiccup. Three consecutive timeouts (error_count >= 3) indicate a real problem. Break the polling cycle early to avoid hammering a dead connection.

The gateway should treat the connection state itself as a telemetry point. When the PLC link goes up or down, immediately publish a link state tag — a boolean value with do_not_batch: true:

link_state_changed(device, new_state):
publish_immediately(
tag_id=LINK_STATE_TAG,
value=new_state, // true=up, false=down
timestamp=now()
)

This gives operators cloud-side visibility into gateway connectivity. A dashboard can show "Device offline since 2:47 AM" instead of just "no data" — which is ambiguous (was the device off, or was the gateway offline?).

Pattern 3: Store-and-Forward Buffering

When MQTT is disconnected, you can't just drop data. A production gateway needs a paged ring buffer that accumulates data during disconnections and drains it when connectivity returns.

Paged Buffer Architecture

The buffer divides a fixed-size memory region into pages of equal size:

Total buffer: 2 MB
Page size: ~4 KB (derived from max batch size)
Pages: ~500

Page states:
FREE → Available for writing
WORK → Currently being written to
USED → Full, queued for delivery

The lifecycle:

  1. Writing: Data is appended to the WORK page. When it's full, WORK moves to the USED queue, and a FREE page becomes the new WORK page.
  2. Sending: When MQTT is connected, the first USED page is sent. On PUBACK confirmation, the page moves to FREE.
  3. Overflow: If all pages are USED (buffer full, MQTT down for too long), the oldest USED page is recycled as the new WORK page. This loses the oldest data to preserve the newest — the right tradeoff for most industrial applications.

Thread safety is critical. The PLC polling thread writes to the buffer, the MQTT thread reads from it, and the PUBACK callback advances the read pointer. A mutex protects all buffer operations:

buffer_add_data(data, size):
lock(mutex)
append_to_work_page(data, size)
if work_page_full():
move_work_to_used()
try_send_next()
unlock(mutex)

on_puback(packet_id):
lock(mutex)
advance_read_pointer()
if page_fully_delivered():
move_page_to_free()
try_send_next()
unlock(mutex)

on_disconnect():
lock(mutex)
connected = false
packet_in_flight = false // reset delivery state
unlock(mutex)

Sizing the Buffer

Buffer sizing depends on your data rate and your maximum acceptable offline duration:

buffer_size = data_rate_bytes_per_second × max_offline_seconds

For a typical deployment:

  • 50 tags × 4 bytes average × 1 read/second = 200 bytes/second
  • With binary encoding overhead: ~300 bytes/second
  • Maximum offline duration: 2 hours (7,200 seconds)
  • Buffer needed: 300 × 7,200 = ~2.1 MB

A 2 MB buffer with 4 KB pages gives you ~500 pages — more than enough for 2 hours of offline operation.

The Minimum Three-Page Rule

The buffer needs at minimum 3 pages to function:

  1. One WORK page (currently being written to)
  2. One USED page (queued for delivery)
  3. One page in transition (being delivered, not yet confirmed)

If you can't fit 3 pages in the buffer, the page size is too large relative to the buffer. Validate this at initialization time and reject invalid configurations rather than failing at runtime.

Pattern 4: Periodic Forced Reads

Even with change-detection enabled (the compare flag), a production gateway should periodically force-read all tags and transmit their values regardless of whether they changed. This serves several purposes:

  1. Proof of life. Downstream systems can distinguish "the value hasn't changed" from "the gateway is dead."
  2. State synchronization. If the cloud-side database lost data (a rare but real scenario), periodic full-state updates resynchronize it.
  3. Clock drift correction. Over time, individual tag timers can drift. A periodic full reset realigns all tags.

A practical approach: reset all tags on the hour boundary. Check the system clock, and when the hour rolls over, clear all "previously read" flags. Every tag will be read and transmitted on its next polling cycle, regardless of change detection:

on_each_read_cycle():
current_hour = localtime(now()).hour
previous_hour = localtime(last_read_time).hour

if current_hour != previous_hour:
reset_all_tags() // clear read-once flags
log("Hourly forced read: all tags will be re-read")

This adds at most one extra transmission per tag per hour — a negligible bandwidth cost for significant reliability improvement.

Pattern 5: SAS Token and Certificate Expiry Monitoring

If your MQTT connection uses time-limited credentials (like Azure IoT Hub SAS tokens or short-lived TLS certificates), the gateway must monitor expiry and refresh proactively.

For SAS tokens, extract the se (expiry) parameter from the connection string and compare it against the current system time:

on_config_load(sas_token):
expiry_timestamp = extract_se_parameter(sas_token)

if current_time > expiry_timestamp:
log_warning("Token has expired!")
// Still attempt connection — the broker will reject it,
// but the error path will trigger a config reload
else:
time_remaining = expiry_timestamp - current_time
log("Token valid for %d hours", time_remaining / 3600)

Don't silently fail. If the token is expired, log a prominent warning. The gateway should still attempt to connect (the broker rejection will be informative), but operations teams need visibility into credential lifecycle.

For TLS certificates, monitor both the certificate file's modification time (has a new cert been deployed?) and the certificate's validity period (is it about to expire?).

How machineCDN Implements These Patterns

machineCDN's edge gateway — deployed on OpenWRT-based industrial routers in plastics manufacturing plants — implements all five patterns:

  • Configuration hot-reload using stat() polling on the main loop, with pool-allocated memory for zero-leak teardown/rebuild cycles
  • Dual watchdogs for MQTT delivery confirmation (120-second timeout) and PLC link state (3 consecutive errors trigger reconnection)
  • Paged ring buffer with 2 MB capacity, supporting both JSON and binary encoding, with automatic overflow handling that preserves newest data
  • Hourly forced reads that ensure complete state synchronization regardless of change detection
  • SAS token monitoring with proactive expiry warnings

These patterns enable 99.9%+ data capture rates even in plants with intermittent cellular connectivity — because the gateway collects data continuously and back-fills when connectivity returns.

Implementation Checklist

If you're building or evaluating an edge gateway for industrial IoT, verify that it supports:

CapabilityWhy It Matters
Config hot-reload without restartZero-downtime updates, no data gaps during reconfiguration
Pool-based memory allocationNo memory leaks across reload cycles
MQTT delivery watchdogDetects silent connection failures
Async reconnection threadPLC polling continues during MQTT recovery
Paged store-and-forward bufferPreserves data during network outages
Consecutive error thresholdsAvoids false-positive disconnections
Link state telemetryDistinguishes "offline gateway" from "idle machine"
Periodic forced readsState synchronization and proof-of-life
Credential expiry monitoringProactive certificate/token management

Conclusion

Reliability in industrial IoT isn't about preventing failures — it's about recovering from them automatically. Networks will drop. PLCs will reboot. Certificates will expire. The question is whether your edge gateway handles these events gracefully or silently loses data.

The patterns in this guide — hot-reload, watchdogs, store-and-forward, forced reads, and credential monitoring — are the difference between a gateway that works in the lab and one that works at 3 AM on a holiday weekend in a plant with spotty cellular coverage.

Build for the 3 AM scenario. Your operations team will thank you.

Edge Gateway Lifecycle Architecture: From Boot to Steady-State Telemetry in Industrial IoT [2026]

· 14 min read

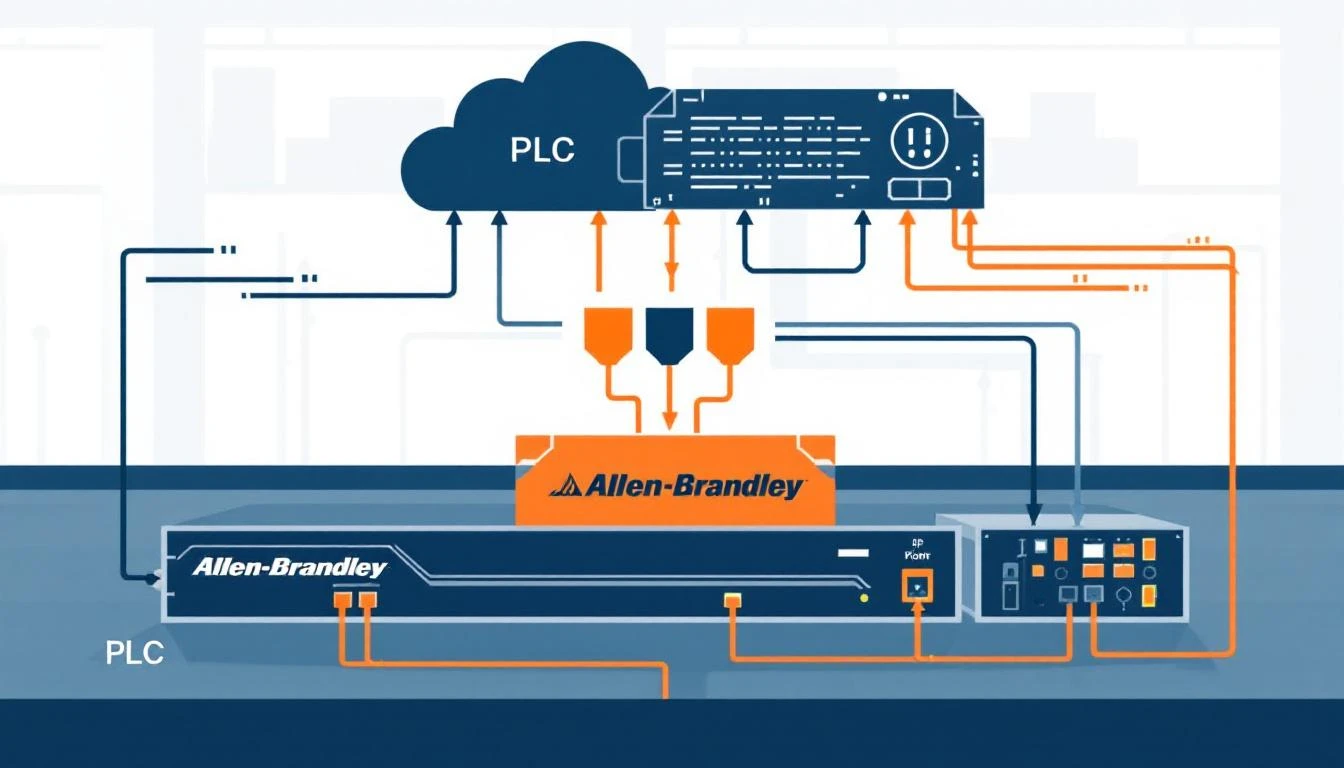
Most IIoT content treats the edge gateway as a black box: PLC data goes in, cloud data comes out. That's fine for a sales deck. It's useless for the engineer who needs to understand why their gateway loses data during a network flap, or why configuration changes require a full restart, or why it takes 90 seconds after boot before the first telemetry packet reaches the cloud.

This article breaks down the complete lifecycle of a production industrial edge gateway — from the moment it powers on to steady-state telemetry delivery, including every decision point, failure mode, and recovery mechanism in between. These patterns are drawn from real-world gateways running on resource-constrained hardware (64MB RAM, MIPS processors) in plastics manufacturing plants, monitoring TCUs, chillers, blenders, and dryers 24/7.

Phase 1: Boot and Configuration Load

When a gateway boots (or restarts after a configuration change), the first task is loading its configuration. In production deployments, there are typically two configuration layers:

The Daemon Configuration

This is the central configuration that defines what equipment to talk to:

{
"plc": {
"ip": "192.168.5.5",
"modbus_tcp_port": 502
},
"serial_device": {
"port": "/dev/rs232",
"baud": 9600,
"parity": "none",
"data_bits": 8,
"stop_bits": 1,
"byte_timeout_ms": 4,
"response_timeout_ms": 100
},
"batch_size": 4000,
"batch_timeout_sec": 60,
"startup_delay_sec": 30
}

The startup delay is a critical design choice. When a gateway boots simultaneously with the PLCs it monitors (common after a power outage), the PLCs may need 10-30 seconds to initialize their communication stacks. If the gateway immediately tries to connect, it fails, marks the PLC as unreachable, and enters a slow retry loop. A 30-second startup delay avoids this race condition.

The serial link parameters (baud, parity, data bits, stop bits) must match the PLC exactly. A mismatch here produces zero error feedback — you just get silence. The byte timeout (time between consecutive bytes) and response timeout (time to wait for a complete response) are tuned per equipment type. TCUs with slower processors may need 100ms+ response timeouts; modern PLCs respond in 10-20ms.

The Device Configuration Files

Each equipment type gets its own configuration file that defines which registers to read, what data types to expect, and how often to poll. These files are loaded dynamically based on the device type detected during the discovery phase.

A real device configuration for a batch blender might define 40+ tags, each with:

  • A unique tag ID (1-32767)
  • The Modbus register address or EtherNet/IP tag name
  • Data type (bool, int8, uint8, int16, uint16, int32, uint32, float)
  • Element count (1 for scalars, 2+ for arrays or multi-register values)
  • Poll interval in seconds
  • Whether to compare with previous value (change-based delivery)
  • Whether to send immediately or batch with other values

Hot-reload capability is essential for production systems. The gateway should monitor configuration file timestamps and automatically detect changes. When a configuration file is modified (pushed via MQTT from the cloud, or copied via SSH during maintenance), the gateway reloads it without requiring a full restart. This means configuration updates can be deployed remotely to gateways in the field without disrupting data collection.

Phase 2: Device Detection

After configuration loads successfully, the gateway enters the device detection phase. This is where protocol-level intelligence matters.

Multi-Protocol Discovery

A well-designed gateway doesn't assume which protocol the PLC speaks. Instead, it tries multiple protocols in order of preference:

Step 1: Try EtherNet/IP

The gateway sends a CIP (Common Industrial Protocol) request to the configured IP address, attempting to read a device_type tag. EtherNet/IP uses the ab-eip protocol with a micro800 CPU profile (for Allen-Bradley Micro8xx series). If the PLC responds with a valid device type, the gateway knows this is an EtherNet/IP device.

Connection path: protocol=ab-eip, gateway=192.168.5.5, cpu=micro800
Target tag: device_type (uint16)
Timeout: 2000ms

Step 2: Fall back to Modbus TCP

If EtherNet/IP fails (error code -32 = "no connection"), the gateway tries Modbus TCP on port 502. It reads input register 800 (address 300800) which, by convention, stores the device type identifier.

Function code: 4 (Read Input Registers)
Register: 800
Count: 1
Expected: uint16 device type code

Step 3: Serial detection for Modbus RTU

If TCP protocols fail, the gateway probes the serial port for Modbus RTU devices. RTU detection is trickier because there's no auto-discovery mechanism — you must know the slave address. Production gateways typically configure a default address (slave ID 1) and attempt a read.

Serial Number Extraction

After identifying the device type, the gateway reads the equipment's serial number. This is critical for fleet management — each physical machine needs a unique identifier for cloud-side tracking.

Different equipment types store serial numbers in different registers:

Equipment TypeProtocolMonth RegisterYear RegisterUnit Register
Portable ChillerModbus TCPInput 22Input 23Input 24
Central ChillerModbus TCPHolding 520Holding 510Holding 500
TCUModbus RTUEtherNet/IPEtherNet/IPEtherNet/IP
Batch BlenderEtherNet/IPCIP tagCIP tagCIP tag

The serial number is packed into a 32-bit value:

Byte 3: Year  (0x40=2010, 0x41=2011, ...)
Byte 2: Month (0x00=Jan, 0x01=Feb, ...)
Bytes 0-1: Unit number (sequential)

Example: 0x002A0050 = January 2010, unit #80

Fallback serial generation: If the PLC doesn't have a programmed serial number (common with newly installed equipment), the gateway generates one using the router's serial number as a seed, with a prefix byte distinguishing PLCs (0x7F) from TCUs (0x7E). This ensures every device in the fleet has a unique identifier even before the serial number is programmed.

Configuration Loading by Device Type

Once the device type is known, the gateway searches for a matching configuration file. If type 1010 is detected, it loads the batch blender configuration. If type 5000, it loads the TCU configuration. If no matching configuration exists, the gateway logs an error and continues monitoring other ports.

This pattern — detect → identify → configure — means a single gateway binary handles dozens of equipment types. Adding support for a new machine is a configuration file change, not a firmware update.

With devices detected and configured, the gateway establishes its cloud connection via MQTT.

Connection Architecture

Production IIoT gateways use MQTT 3.1.1 over TLS (port 8883) for cloud connectivity. The connection setup involves:

  1. Certificate verification — the gateway validates the cloud broker's certificate against a CA root cert stored locally
  2. SAS token authentication — using a device-specific Shared Access Signature that encodes the hostname, device ID, and expiration timestamp
  3. Topic subscription — after connecting, the gateway subscribes to its command topic for receiving configuration updates and control commands from the cloud
Publish topic:  devices/{deviceId}/messages/events/
Subscribe topic: devices/{deviceId}/messages/devicebound/#
QoS: 1 (at least once delivery)

QoS 1 is the standard choice for industrial telemetry — it guarantees message delivery while avoiding the overhead and complexity of QoS 2 (exactly once). Since the data pipeline is designed to handle duplicates (via timestamp deduplication at the cloud layer), QoS 1 provides the right balance of reliability and performance.

The Async Connection Thread

MQTT connection can take 5-30 seconds depending on network conditions, DNS resolution, and TLS handshake time. A naive implementation blocks the main loop during connection, which means no PLC data is read during this time.

The solution: run mosquitto_connect_async() in a separate thread. The main loop continues reading PLC tags and buffering data while the MQTT connection establishes in the background. Once the connection callback fires, buffered data starts flowing to the cloud.

This is implemented using a semaphore-based producer-consumer pattern:

  1. Main thread prepares connection parameters and posts to a semaphore
  2. Connection thread wakes up, calls connect_async(), and signals completion
  3. Main thread checks semaphore state before attempting reconnection (prevents double-connect)

Connection Watchdog

Network connections fail. Cell modems lose signal. Cloud brokers restart. A production gateway needs a watchdog that detects stale connections and forces reconnection.

The watchdog pattern:

Every 120 seconds:
1. Check: have we received ANY confirmation from the broker?
(delivery ACK, PUBACK, SUBACK — anything)
2. If yes → connection is healthy, reset watchdog timer
3. If no → connection is stale. Destroy MQTT client and reinitiate.

The 120-second timeout is tuned for cellular networks where intermittent connectivity is expected. On wired Ethernet, you could reduce this to 30-60 seconds. The key insight: don't just check "is the TCP socket open?" — check "has the broker confirmed any data delivery recently?" A half-open socket can persist for hours without either side knowing.

Phase 4: Steady-State Tag Reading

Once PLC connections and MQTT are established, the gateway enters its main polling loop. This is where it spends 99.9% of its runtime.

The Main Loop (1-second resolution)

The core loop runs every second and performs three operations:

  1. Configuration check — detect if any configuration file has been modified (via file stat monitoring)
  2. Tag read cycle — iterate through all configured tags and read those whose polling interval has elapsed
  3. Command processing — check the incoming command queue for cloud-side instructions (config updates, manual reads, interval changes)

Interval-Based Polling

Each tag has a polling interval in seconds. The gateway maintains a monotonic clock timestamp of the last read for each tag. On each loop iteration:

for each tag in device.tags:
elapsed = now - tag.last_read_time
if elapsed >= tag.interval_sec:
read_tag(tag)
tag.last_read_time = now

Typical intervals by data category:

Data TypeIntervalRationale
Temperatures, pressures60sSlow-changing process values
Alarm states (booleans)1sImmediate awareness needed
Machine state (running/idle)1sOEE calculation accuracy
Batch counts1sProduction tracking
Version, serial number3600sStatic values, verify hourly

Compare Mode: Change-Based Delivery

For many tags, sending the same value every second is wasteful. If a chiller alarm bit is false for 8 hours straight, that's 28,800 redundant messages.

Compare mode solves this: the gateway stores the last-read value and only delivers to the cloud when the value changes. This is configured per tag:

{
"name": "Compressor Fault Alarm",
"type": "bool",
"interval": 1,
"compare": true,
"do_not_batch": true
}

This tag is read every second, but only transmitted when it changes. The do_not_batch flag means changes are sent immediately rather than waiting for the next batch finalization — critical for alarm states where latency matters.
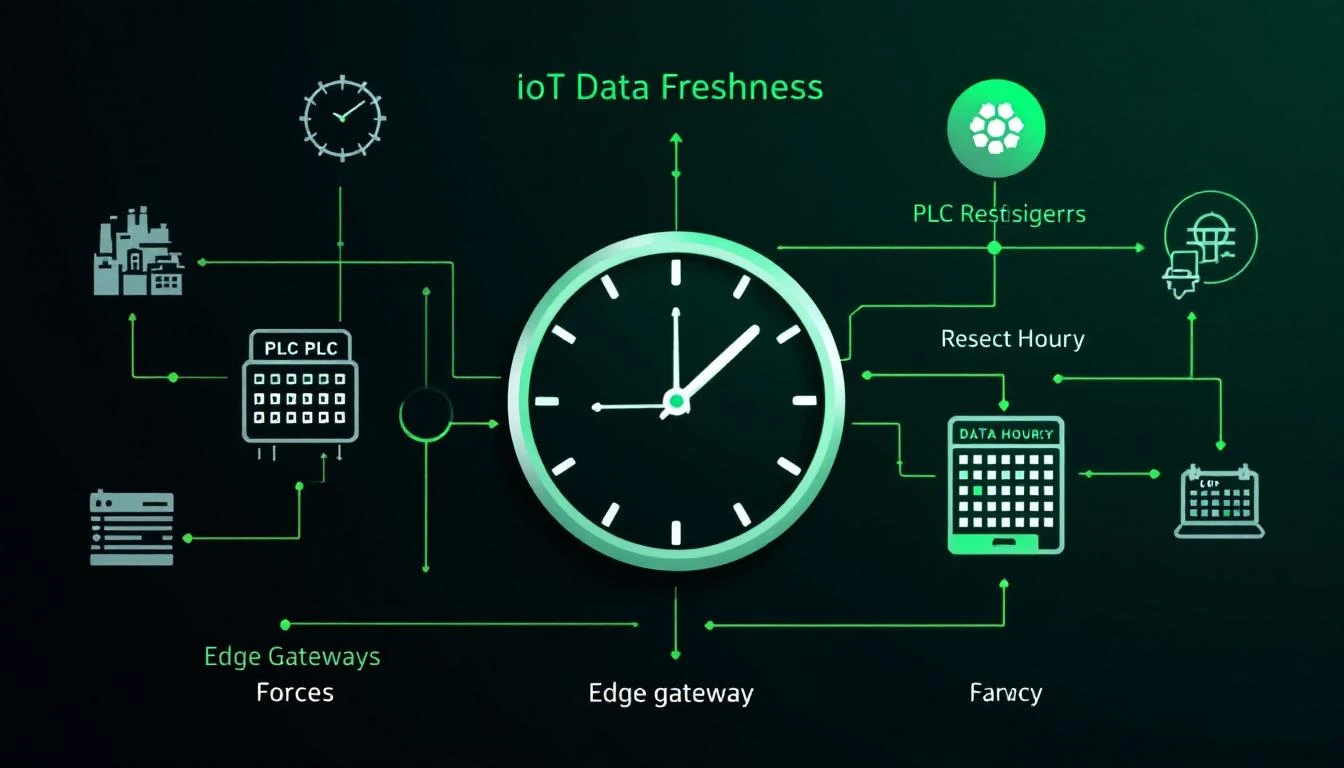
Hourly Full Refresh

There's a subtle problem with pure change-based delivery: if a value changes while the MQTT connection is down, the cloud never learns about the transition. And if a value stays constant for days, the cloud has no heartbeat confirming the sensor is still alive.

The solution: every hour (on the hour change), the gateway resets all "read once" flags, forcing a complete re-read and re-delivery of all tags. This guarantees the cloud has fresh values at least hourly, regardless of change activity.

Phase 5: Data Batching and Delivery

Raw tag values don't get sent individually (except high-priority alarms). Instead, they're collected into batches for efficient delivery.

Binary Encoding

Production gateways use binary encoding rather than JSON to minimize bandwidth. The binary format packs values tightly:

Header:        1 byte  (0xF7 = tag values)
Group count: 4 bytes (number of timestamp groups)

Per group:
Timestamp: 4 bytes
Device type: 2 bytes
Serial num: 4 bytes
Value count: 4 bytes

Per value:
Tag ID: 2 bytes
Status: 1 byte (0x00=OK, else error code)
Array size: 1 byte (if status=OK)
Elem size: 1 byte (1, 2, or 4 bytes per element)
Data: size × count bytes

A batch containing 20 float values uses about 200 bytes in binary vs. ~2,000 bytes in JSON — a 10× bandwidth reduction that matters on cellular connections billed per megabyte.

Batch Finalization Triggers

A batch is finalized (sent to MQTT) when either:

  1. Size threshold — the batch reaches the configured maximum size (default: 4,000 bytes)
  2. Time threshold — the batch has been collecting for longer than batch_timeout_sec (default: 60 seconds)

This ensures data reaches the cloud within 60 seconds even during low-activity periods, while maximizing batch efficiency during high-activity periods (like a blender running a batch cycle that triggers many dependent tag reads).

The Paged Ring Buffer

Between the batching layer and the MQTT publish layer sits a paged ring buffer. This is the gateway's resilience layer against network outages.

The buffer divides available memory into fixed-size pages. Each page holds one or more complete MQTT messages. The buffer operates as a queue:

  • Write side: Finalized batches are written to the current work page. When a page fills up, it moves to the "used" queue.
  • Read side: When MQTT is connected, the gateway publishes the oldest used page. Upon receiving a PUBACK (delivery confirmation), the page moves to the "free" pool.
  • Overflow: If all pages are used (network down too long), the gateway overwrites the oldest used page — losing the oldest data to preserve the newest.

This design means the gateway can buffer 15-60 minutes of telemetry data during a network outage (depending on available memory and data density), then drain the buffer once connectivity restores.

Disconnect Recovery

When the MQTT connection drops:

  1. The buffer's "connected" flag is cleared
  2. All pending publish operations are halted
  3. Incoming PLC data continues to be read, batched, and buffered
  4. The MQTT async thread begins reconnection
  5. On reconnection, the buffer's "connected" flag is set, and data delivery resumes from the oldest undelivered page

This means zero data loss during short outages (up to the buffer capacity), and newest-data-preserved during long outages (the overflow policy drops oldest data first).

Phase 6: Remote Configuration and Control

A production gateway accepts commands from the cloud over its MQTT subscription topic. This enables remote management without SSH access.

Supported Command Types

CommandDirectionDescription
daemon_configCloud → DeviceUpdate central configuration (IP addresses, serial params)
device_configCloud → DeviceUpdate device-specific tag configuration
get_statusCloud → DeviceRequest current daemon/PLC/TCU status report
get_status_extCloud → DeviceRequest extended status with last tag values
read_now_plcCloud → DeviceForce immediate read of a specific tag
tag_updateCloud → DeviceChange a tag's polling interval remotely

Remote Interval Adjustment

This is a powerful production feature: the cloud can remotely change how often specific tags are polled. During a quality investigation, an engineer might temporarily increase temperature polling from 60s to 5s to capture rapid transients. After the investigation, they reset to 60s via another command.

The gateway applies interval changes immediately and persists them to the configuration file, so they survive a restart. The modified_intervals flag in status reports tells the cloud that intervals have been manually adjusted.

Designing for Constrained Hardware

These gateways often run on embedded Linux routers with severely constrained resources:

  • RAM: 64-128MB (of which 30-40MB is available after OS)
  • CPU: MIPS or ARM, 500-800 MHz, single core
  • Storage: 16-32MB flash (no disk)
  • Network: Cellular (LTE Cat 4/Cat M1) or Ethernet

Design constraints this imposes:

  1. Fixed memory allocation — allocate all buffers at startup, never malloc() during runtime. A memory fragmentation crash at 3 AM in a factory with no IT staff is unrecoverable.

  2. No floating-point unit — older MIPS processors do software float emulation. Keep float operations to a minimum; do heavy math in the cloud.

  3. Flash wear — don't write configuration changes to flash more than necessary. Batch writes, use write-ahead logging if needed.

  4. Watchdog timer — use the hardware watchdog timer. If the main loop hangs, the hardware reboots the gateway automatically.

How machineCDN Implements These Patterns

machineCDN's ACS (Auxiliary Communication System) gateway embodies all of these lifecycle patterns in a production-hardened implementation that's been running on thousands of plastics manufacturing machines for years.

The gateway runs on Teltonika RUT9XX industrial cellular routers, providing cellular connectivity for machines in facilities without available Ethernet. It supports EtherNet/IP and Modbus (both TCP and RTU) simultaneously, auto-detecting device types at boot and loading the appropriate configuration from a library of pre-built equipment profiles.

For manufacturers deploying machineCDN, the complexity described in this article — protocol detection, configuration management, MQTT buffering, recovery — is entirely handled by the platform. The result is that plant engineers get reliable, continuous telemetry from their equipment without needing to understand (or debug) the edge gateway's internal lifecycle.


Understanding how edge gateways actually work — not just what they do, but how they manage their lifecycle — is essential for building reliable IIoT infrastructure. The patterns described here (startup sequencing, multi-protocol detection, buffered delivery, watchdog recovery) separate toy deployments from production systems that run for years without intervention.

EtherNet/IP Device Auto-Discovery: How Edge Gateways Identify PLCs on the Plant Floor [2026]

· 9 min read

Walk onto any modern plant floor and you'll find a patchwork of controllers — Allen-Bradley Micro800 series running EtherNet/IP, Modbus TCP devices from half a dozen vendors, maybe a legacy RTU on a serial port somewhere. The edge gateway sitting in that control cabinet needs to figure out what it's talking to, what protocol to use, and how to pull the right data — ideally without a technician manually configuring every register.

This is the device auto-discovery problem, and solving it well is the difference between a two-hour commissioning versus a two-day one.

The Discovery Sequence: Try EtherNet/IP First, Fall Back to Modbus

The most reliable approach follows a dual-protocol detection pattern. When an edge gateway powers up and finds a PLC at a known IP address, it shouldn't assume which protocol that device speaks. Instead, it runs a detection sequence:

Step 1: Attempt EtherNet/IP (CIP) Connection

EtherNet/IP uses the Common Industrial Protocol (CIP) over TCP port 44818. The gateway attempts to create a connection to a known tag — typically a device_type identifier that the PLC firmware exposes as a readable tag.

Protocol: ab-eip
Gateway: 192.168.1.100
CPU: micro800
Tag: device_type
Element Size: 2 bytes (uint16)
Element Count: 1
Timeout: 2000ms

If this connection succeeds and returns a non-zero value, the gateway knows it's talking to an EtherNet/IP device and can proceed to read the serial number components.

Step 2: If EtherNet/IP fails, try Modbus TCP

If the CIP connection returns an error (typically error code -32, indicating no route to host at the CIP layer), the gateway falls back to Modbus TCP on port 502.

For Modbus detection, the gateway reads input register 800 (address 0x300320 in the full Modbus address space — function code 4). This register holds the device type identifier by convention in many industrial equipment families.

Protocol: Modbus TCP
Port: 502
Function Code: 4 (Read Input Registers)
Start Address: 800
Register Count: 1

Step 3: Extract Serial Number

Once the device type is known, the gateway reads serial number components. Here's where things get vendor-specific. Different PLC families store their serial numbers in completely different register locations:

Device TypeProtocolMonth RegisterYear RegisterUnit Register
Micro800 PLCEtherNet/IPTag: serial_number_monthTag: serial_number_yearTag: serial_number_unit
GP Chiller (1017)Modbus TCPInput Reg 22Input Reg 23Input Reg 24
HE Chiller (1018)Modbus TCPHolding Reg 520Holding Reg 510Holding Reg 500
TS5 TCU (1021)Modbus TCPHolding Reg 1039Holding Reg 1038Holding Reg 1040

Notice the inconsistency — even within the same protocol, each device family stores its serial number in different registers, uses different function codes (input registers vs. holding registers), and sometimes the year/month/unit ordering isn't sequential in memory. This is real-world industrial automation, not a textbook.

Serial Number Encoding: Packing Identity into 32 Bits

Once you have the three components (year, month, unit number), they're packed into a single 32-bit serial number for efficient transport:

Byte 3 (bits 31-24): Year  (0x00-0xFF)
Byte 2 (bits 23-16): Month (0x00-0xFF)
Bytes 1-0 (bits 15-0): Unit Number (0x0000-0xFFFF)

This encoding allows up to 65,535 units per month per year — more than sufficient for any production line. A serial number of 0x18031A2B decodes to: year 0x18 (24), month 0x03 (March), unit 0x1A2B (6699).

Validation Matters

A serial number where the year byte is zero is invalid — it almost certainly means the PLC hasn't been properly commissioned or the register read returned garbage data. Your gateway should reject these and report a "bad serial number" status rather than silently accepting a device with identity 0x00000000.

The Configuration Lookup Pattern

Once the gateway knows the device type (e.g., type 1018 = HE Central Chiller), it needs to load the right tag configuration. The proven pattern is a directory scan:

  1. Maintain a directory of JSON configuration files (one per device type)
  2. On detection, scan the directory and match the device_type field in each JSON
  3. Load the matched configuration, which defines all tags, their data types, read intervals, and batching behavior
{
"device_type": 1018,
"version": "2.4.1",
"name": "HE Central Chiller",
"protocol": "modbus-tcp",
"plctags": [
{
"name": "supply_temp",
"id": 1,
"type": "float",
"addr": 400100,
"ecount": 2,
"interval": 5,
"compare": true
},
{
"name": "compressor_status",
"id": 2,
"type": "uint16",
"addr": 400200,
"interval": 1,
"compare": true,
"do_not_batch": true
}
]
}

Key design decisions in this configuration:

  • compare: true means only transmit when the value changes — critical for reducing bandwidth on cellular connections
  • do_not_batch: true means send immediately rather than accumulating in a batch — used for status changes and alarms that need real-time delivery
  • interval defines the polling frequency in seconds — fast-changing temperatures might be 5 seconds, while a compressor on/off status needs sub-second reads
  • ecount: 2 for floats means reading two consecutive 16-bit Modbus registers and combining them into an IEEE 754 float

Handling Modbus Address Conventions

One of the trickiest aspects of Modbus auto-discovery is the address-to-function-code mapping. Different vendors use different conventions, but the most common maps addresses to function codes like this:

Address RangeFunction CodeRegister Type
0–65536FC 1Coils (read/write bits)
100000–165536FC 2Discrete Inputs (read-only bits)
300000–365536FC 4Input Registers (read-only 16-bit)
400000–465536FC 3Holding Registers (read/write 16-bit)

When you see a configured address of 400100, the gateway strips the prefix: the actual Modbus register address sent on the wire is 100, using function code 3.

Register Grouping Optimization

Smart gateways don't read one register at a time. They scan the sorted tag list and identify contiguous address ranges that share the same function code and polling interval. These get combined into a single Modbus read request:

Tags at addresses: 400100, 400101, 400102, 400103, 400104
→ Single request: FC3, start=100, count=5

But grouping has limits. Exceeding ~50 registers per request risks timeouts, especially on Modbus RTU over slow serial links. And you can't group across function code boundaries — a tag at address 300050 (FC4) and 400050 (FC3) must be separate requests, even though they're "near" each other numerically.

Multi-Protocol Detection: The Real-World Sequence

In practice, a gateway on a plant floor often needs to detect multiple devices simultaneously — a PLC on EtherNet/IP and a temperature control unit on Modbus RTU via RS-485. The detection sequence runs in parallel:

  1. EtherNet/IP detection happens over the plant's Ethernet network — standard TCP/IP, fast, usually succeeds or fails within 2 seconds
  2. Modbus TCP detection uses the same Ethernet interface but different port (502) — also fast
  3. Modbus RTU detection happens over a serial port (/dev/ttyUSB0 or similar) — much slower, constrained by baud rate (typically 9600–115200), with byte timeouts around 50ms and response timeouts of 400ms

The serial link parameters are critical and often misconfigured:

Port: /dev/ttyUSB0
Baud Rate: 9600
Parity: None ('N')
Data Bits: 8
Stop Bits: 1
Slave Address: 1
Byte Timeout: 50ms
Response Timeout: 400ms

Getting the parity wrong is the #1 commissioning mistake with Modbus RTU. If the slave expects Even parity and the master sends None, every frame will be rejected silently — no error message, just timeouts.

Connection Resilience: The Watchdog Pattern

Discovery isn't a one-time event. Industrial connections drop — cables get unplugged during maintenance, PLCs get rebooted, network switches lose power. A robust gateway implements a multi-layer resilience strategy:

Link State Tracking: Every successful read sets the link state to "up." Any read error (timeout, connection reset, broken pipe, bad file descriptor) sets it to "down" and triggers a reconnection sequence.

Connection Error Counting: For EtherNet/IP, if you get three consecutive error-32 responses (no CIP route), stop hammering the network and wait for the next polling cycle. For Modbus, error codes like ETIMEDOUT, ECONNRESET, ECONNREFUSED, or EPIPE trigger a modbus_close() followed by reconnection on the next cycle.

Modbus Flush on Error: After a failed Modbus read, always flush the serial/TCP buffer before the next attempt. Stale response bytes from a partial read can corrupt subsequent responses.

Configuration Hot-Reload: The gateway watches its configuration files with stat(). If a file's modification time changes, it triggers a full re-initialization — destroy existing PLC tag handles, reload the JSON configuration, and re-establish all connections. This allows field engineers to update tag configurations without restarting the gateway service.

What machineCDN Brings to the Table

machineCDN's edge infrastructure handles this entire discovery and connection management lifecycle automatically. When you deploy a machineCDN gateway on the plant floor:

  • It auto-detects PLCs across EtherNet/IP and Modbus TCP/RTU simultaneously
  • It loads the correct device configuration from its library of supported equipment types
  • It manages connection resilience with automatic reconnection and buffer management
  • It optimizes Modbus reads by grouping contiguous registers and minimizing request count
  • Tag data flows through a batched delivery pipeline to the cloud, with store-and-forward buffering during connectivity gaps

For plant engineers, this means going from "cable plugged in" to "live data flowing" in minutes rather than days of manual register mapping.

Key Takeaways

  1. Always try EtherNet/IP first — it's faster and provides richer device identity information than Modbus
  2. Don't hardcode serial number locations — they vary wildly across equipment families, even from the same vendor
  3. Validate serial numbers before accepting a device — zero year values indicate bad reads
  4. Group Modbus reads by contiguous address and function code, but cap at 50 registers per request
  5. Implement connection watchdogs — industrial networks are unreliable; your gateway must recover automatically
  6. Flush after errors — stale buffer bytes from partial Modbus reads are the silent killer of data integrity

The device discovery problem isn't glamorous, but getting it right is what separates an IIoT platform that works in the lab from one that survives on a real plant floor.

JSON-Based PLC Tag Configuration: Building Maintainable IIoT Device Templates [2026]

· 12 min read

If you've ever stared at a spreadsheet of 200 PLC register addresses trying to figure out which ones your SCADA system is actually polling, you know the pain. Traditional tag configuration — hardcoded in ladder logic comments, scattered across HMI screens, buried in proprietary configuration tools — doesn't scale.

The solution that's gaining traction in modern IIoT deployments is declarative, JSON-based tag configuration. Instead of configuring your data collection logic in opaque proprietary formats, you define your device's entire tag map as a structured JSON document. This approach brings version control, template reuse, and automated validation to the industrial data layer.

In this guide, we'll walk through the architecture of a production-grade JSON tag configuration system, drawing from real patterns used in industrial edge gateways connecting to Allen-Bradley Micro800 PLCs via EtherNet/IP and to various devices via Modbus RTU and TCP.

JSON-based PLC tag configuration for IIoT

Why JSON for PLC Tag Configuration?

The traditional approach to configuring PLC data collection involves vendor-specific tools: RSLinx for Allen-Bradley, TIA Portal for Siemens, or proprietary gateway configurators. These tools work, but they create several problems at scale:

  • No version control. You can't git diff a proprietary binary config file.
  • No templating. When you deploy the same machine type across 50 sites, you're manually recreating the same configuration 50 times.
  • No validation. Typos in register addresses don't surface until runtime.
  • No automation. You can't script the generation of configurations from a master device database.

JSON solves all of these. A tag configuration becomes a text file that can be:

  • Stored in Git with full change history
  • Templated per device type (one JSON per machine model)
  • Validated against a schema before deployment
  • Generated programmatically from engineering databases

Anatomy of a Tag Configuration Document

A well-structured PLC tag configuration document needs to capture several layers of information:

Device-Level Metadata

Every configuration file should identify the device type it applies to, carry a version string for change tracking, and specify the protocol:

{
"device_type": 1010,
"version": "a3f7b2c",
"name": "Continuous Blender Model X",
"protocol": "ethernet-ip",
"plctags": [ ... ]
}

The device_type field is a numeric identifier that maps to a specific machine model. When an edge gateway auto-detects a PLC (by reading a known register), it uses this type ID to look up the correct configuration file. The version field — ideally a short Git hash — lets you track which configuration version is running on each gateway in the field.

For Modbus devices, you'd also include protocol-specific parameters:

{
"device_type": 5000,
"version": "b8e1d4a",
"name": "Temperature Control Unit",
"protocol": "modbus-rtu",
"base_addr": 48,
"baud": 9600,
"parity": "even",
"data_bits": 8,
"stop_bits": 1,
"byte_timeout": 4,
"resp_timeout": 100,
"plctags": [ ... ]
}

Notice the serial link parameters are part of the same document. This is deliberate — you want a single source of truth for "how to talk to this device and what to read from it."

Tag Definitions: The Core Data Model

Each tag in the configuration represents a single data point you want to collect from the PLC. A complete tag definition captures:

{
"name": "barrel_zone1_temp",
"id": 42,
"type": "float",
"ecount": 2,
"sindex": 0,
"interval": 5,
"compare": true,
"do_not_batch": false
}

Let's break down each field:

name — A human-readable identifier for the tag. For EtherNet/IP (CIP) devices, this is the actual PLC tag name. For Modbus, it's a descriptive label since Modbus uses numeric addresses.

id — A numeric identifier used in the wire protocol when transmitting data to the cloud. Using compact integer IDs instead of string names dramatically reduces payload sizes — critical when you're sending telemetry over cellular connections.

type — The data type of the register value. Common types include:

TypeSizeRangeUse Case
bool1 byte0 or 1Alarm states, run/stop status
int81 byte-128 to 127Small counters, mode selectors
uint81 byte0 to 255Status codes, alarm bytes
int162 bytes-32,768 to 32,767Temperature (×10), pressure
uint162 bytes0 to 65,535RPM, flow rate, raw ADC values
int324 bytes±2.1 billionProduction counters, energy
uint324 bytes0 to 4.2 billionLifetime counters, timestamps
float4 bytesIEEE 754Temperature, weight, setpoints

ecount (element count) — How many consecutive elements to read. For a single register, this is 1. For a 32-bit float stored across two Modbus registers, this is 2. For an array of 10 temperature readings, this is 10.

sindex (start index) — The starting element index for array reads. Combined with ecount, this lets you read slices of PLC arrays without pulling the entire array.

interval — How often (in seconds) to poll this tag. This is where you make intelligent decisions about bandwidth:

  • 1 second: Critical alarms, emergency stops, safety interlocks
  • 5 seconds: Process temperatures, pressures, flows
  • 30 seconds: Setpoints, mode selectors (change infrequently)
  • 300 seconds: Configuration parameters, serial numbers

compare — When true, the gateway compares each new reading against the previous value and only transmits if the value changed. This is the single most impactful optimization for reducing bandwidth and cloud ingestion costs.

do_not_batch — When true, the value is transmitted immediately rather than being accumulated into a batch payload. Use this for critical alarms that need sub-second cloud visibility.

Modbus Address Conventions

For Modbus devices, each tag also carries an addr field that encodes both the register address and the function code:

{
"name": "process_temp",
"id": 10,
"addr": 400100,
"type": "float",
"ecount": 2,
"interval": 5,
"compare": true
}

The address convention follows a well-established pattern:

Address RangeModbus Function CodeRegister Type
0 – 65,536FC 01Coils (read/write)
100,000 – 165,536FC 02Discrete Inputs (read)
300,000 – 365,536FC 04Input Registers (read)
400,000 – 465,536FC 03Holding Registers (R/W)

So addr: 400100 means "holding register at address 100, read via function code 3." This convention eliminates ambiguity about which Modbus function to use — the address itself encodes it.

Why this matters: A common source of bugs in Modbus deployments is using the wrong function code. Someone configures a tag to read address 100 with FC 03 when the device exposes it as an input register (FC 04). With the address convention above, the function code is implicit and unambiguous.

Advanced Patterns: Calculated and Dependent Tags

Simple register reads cover 80% of use cases. But industrial devices often pack multiple boolean values into a single 16-bit alarm word, or have tags whose values only matter when a parent tag changes.

Calculated Tags: Extracting Bits from Alarm Words

Many PLCs pack 16 individual alarm flags into a single uint16 register. Rather than reading 16 separate coils, you read one register and extract the bits:

{
"name": "alarm_word_1",
"id": 50,
"addr": 400200,
"type": "uint16",
"ecount": 1,
"interval": 1,
"compare": true,
"calculated": [
{
"name": "high_temp_alarm",
"id": 51,
"type": "bool",
"shift": 0,
"mask": 1
},
{
"name": "low_pressure_alarm",
"id": 52,
"type": "bool",
"shift": 1,
"mask": 1
},
{
"name": "motor_overload",
"id": 53,
"type": "bool",
"shift": 2,
"mask": 1
}
]
}

When alarm_word_1 is read, the gateway automatically:

  1. Reads the raw uint16 value
  2. For each calculated tag, applies the right-shift and mask to extract the bit
  3. Compares the extracted boolean against its previous value
  4. Only transmits if the bit actually changed

This is vastly more efficient than polling 16 individual coils — one Modbus read instead of 16, with identical semantic output.

Dependent Tags: Event-Driven Secondary Reads

Some tags only need to be read when a related tag changes. For example, you might have a machine_state register that changes between IDLE, RUNNING, and FAULT. When it changes, you want to immediately read a block of diagnostic registers — but you don't want to poll those diagnostics every cycle when the machine state is stable.

{
"name": "machine_state",
"id": 100,
"addr": 400001,
"type": "uint16",
"ecount": 1,
"interval": 1,
"compare": true,
"dependents": [
{
"name": "fault_code",
"id": 101,
"addr": 400010,
"type": "uint16",
"ecount": 1,
"interval": 60
},
{
"name": "fault_timestamp",
"id": 102,
"addr": 400011,
"type": "uint32",
"ecount": 2,
"interval": 60
}
]
}

When machine_state changes, the gateway forces an immediate read of all dependent tags, regardless of their normal polling interval. This gives you:

  • Low latency on state transitions — fault diagnostics arrive within 1 second of the fault occurring
  • Low bandwidth during steady state — diagnostic registers are only polled every 60 seconds when nothing is happening

Contiguous Register Optimization

One of the most impactful optimizations in Modbus data collection is contiguous register grouping. Instead of making separate Modbus read requests for each tag, the gateway sorts tags by address and groups adjacent registers into single bulk reads.

Consider these tags:

[
{ "name": "temp_1", "addr": 400100, "ecount": 1 },
{ "name": "temp_2", "addr": 400101, "ecount": 1 },
{ "name": "temp_3", "addr": 400102, "ecount": 1 },
{ "name": "pressure", "addr": 400103, "ecount": 2 }
]

A naive implementation makes four separate Modbus requests. An optimized one makes one request: read 5 registers starting at address 400100. The response contains all four values, which are dispatched to the correct tag definitions.

For this optimization to work, the configuration system must:

  1. Sort tags by address at load time, not at runtime
  2. Validate that function codes match — you can't group a coil read (FC 01) with a holding register read (FC 03)
  3. Respect maximum packet sizes — Modbus TCP allows up to 125 registers per read; some devices are more restrictive
  4. Respect polling intervals — only group tags that share the same polling interval

The performance difference is dramatic. A typical PLC with 50 Modbus tags might require 50 individual reads (50 × ~10ms = 500ms per cycle) or 5 grouped reads (5 × ~10ms = 50ms per cycle). That's a 10× improvement in polling speed.

IEEE 754 Float Handling: The Register Order Problem

Reading 32-bit floating-point values over Modbus is notoriously tricky because the Modbus specification doesn't define register byte ordering for multi-register values. A float spans two 16-bit registers, and different PLCs may store them in different orders:

  • Big-endian (AB CD): Register N contains the high word, N+1 the low word
  • Little-endian (CD AB): Register N contains the low word, N+1 the high word
  • Mid-endian (BA DC or DC BA): Each word's bytes are swapped

Your tag configuration should support specifying the byte order, or at least document which convention your gateway assumes. Most libraries (libmodbus, for example) provide helper functions like modbus_get_float() that assume big-endian by default — but always verify against your specific PLC.

Pro tip: When commissioning a new device, read a register where you know the expected value (e.g., a temperature setpoint showing 72.0°F on the HMI). If the gateway reads 72.0, your byte order is correct. If it reads 2.388e-38 or 1.23e+12, you have a byte-order mismatch.

Binary vs. JSON Telemetry Encoding

Once you've collected your tag values, you need to transmit them. Your configuration should support both JSON and binary encoding, with the choice driven by bandwidth constraints:

JSON encoding is human-readable and debuggable:

{
"groups": [{
"ts": 1709500800,
"device_type": 1010,
"serial_number": 85432,
"values": [
{ "id": 42, "values": [72.3] },
{ "id": 43, "values": [true] }
]
}]
}

Binary encoding is 3-5× smaller. A typical binary frame packs:

  • 1-byte header marker
  • 4-byte group count
  • Per group: 4-byte timestamp, 2-byte device type, 4-byte serial number, 4-byte value count
  • Per value: 2-byte tag ID, 1-byte status, 1-byte value count, 1-byte value size, then raw value bytes

A batch that's 2,000 bytes in JSON might be 400 bytes in binary. Over a cellular connection billed per megabyte, that savings compounds fast.

Putting It All Together: Configuration Lifecycle

A production deployment follows this lifecycle:

  1. Template creation: For each machine model, create a JSON tag configuration. Store it in Git.
  2. Deployment: Push configurations to edge gateways via your device management platform. The gateway monitors the config file and reloads automatically when it changes.
  3. Auto-detection: When the gateway starts, it queries the PLC for its device type (a known register). It then matches the type to the correct configuration file.
  4. Validation: At load time, validate register addresses (no duplicates, valid ranges), data types, and interval values. Reject invalid configs before they cause runtime errors.
  5. Runtime: The gateway polls tags according to their configured intervals, applies change detection, groups contiguous registers, and batches values for transmission.

How machineCDN Handles Tag Configuration

machineCDN's edge gateway uses this exact pattern — JSON-based device templates that are automatically selected based on PLC auto-detection. Each machine type in a plastics manufacturing facility (blenders, dryers, granulators, chillers, TCUs) has its own configuration template with pre-mapped tags, optimized polling intervals, and calculated alarm decomposition.

When a new machine is connected, the gateway detects the PLC type, loads the matching template, and starts collecting data — typically in under 30 seconds with zero manual configuration. For plants running 20+ machines across 5 different models, this eliminates weeks of commissioning time.

Common Pitfalls

1. Overlapping addresses. Two tags pointing to the same register with different IDs will cause confusion in your data pipeline. Validate for uniqueness at load time.

2. Wrong element count for floats. A 32-bit float on Modbus requires ecount: 2 (two 16-bit registers). Setting ecount: 1 gives you garbage data.

3. Polling too fast on serial links. Modbus RTU over RS-485 at 9600 baud can handle roughly 10-15 register reads per second. If you configure 50 tags at 1-second intervals, you'll never keep up. Budget your polling rate against your link speed.

4. Missing change detection on high-volume tags. Without compare: true, every reading gets transmitted. For a tag polled every second, that's 86,400 data points per day — even if the value never changed.

5. Batch timeout too long. If your batch timeout is 60 seconds but an alarm fires, it won't reach the cloud for up to a minute unless that alarm tag has do_not_batch: true.

Conclusion

JSON-based tag configuration isn't just a nice-to-have — it's a fundamental enabler for scaling IIoT deployments. It brings software engineering best practices (version control, templating, validation, automation) to a domain that has traditionally relied on manual, vendor-specific tooling.

The key design principles are:

  • One file per device type with version tracking
  • Rich tag metadata covering data types, intervals, and delivery modes
  • Hierarchical relationships for calculated and dependent tags
  • Protocol-aware addressing that encodes function codes implicitly
  • Contiguous register grouping for optimal Modbus performance

Get this foundation right, and you'll spend your time analyzing machine data instead of debugging data collection.

Modbus Float Encoding: How to Correctly Read IEEE 754 Values from Industrial PLCs [2026]

· 11 min read

If you've spent any time integrating PLCs with an IIoT platform, you've encountered the moment: you read a temperature register that should show 72.5°F, but instead you get 1,118,044,160. Or worse — NaN. Or a negative number that makes zero physical sense.

Welcome to the Modbus float encoding problem. It's the #1 source of confusion in industrial data integration, and it trips up experienced engineers just as often as beginners.

This guide goes deep on how 32-bit floating-point values are actually stored and transmitted over Modbus — covering register pairing, word-swap variants, byte ordering, and the practical techniques that production IIoT systems use to get correct readings from heterogeneous equipment fleets.

Why Modbus and Floats Don't Play Nicely Together

The original Modbus specification (1979) defined only 16-bit registers. Each holding register (4xxxx) or input register (3xxxx) stores exactly one unsigned 16-bit word — values from 0 to 65,535.

But modern PLCs need to represent temperatures like 215.7°F, flow rates like 3.847 GPM, and pressures like 127.42 PSI. A 16-bit integer can't hold these values with the precision operators need.

The solution: pack an IEEE 754 single-precision float (32 bits) across two consecutive Modbus registers. Simple enough in theory. In practice, it's a minefield.

The IEEE 754 Layout

A 32-bit float uses this bit structure:

Bit:  31  30..23   22..0
S EEEEEEEE MMMMMMMMMMMMMMMMMMMMMMM
│ │ └── Mantissa (23 bits)
│ └── Exponent (8 bits, biased by 127)
└── Sign (1 bit: 0=positive, 1=negative)

The float value 72.5 encodes as 0x42910000:

  • Sign: 0 (positive)
  • Exponent: 10000101 (133 - 127 = 6)
  • Mantissa: 00100010000000000000000

That 32-bit value needs to be split across two 16-bit registers. Here's where the problems start.

The Four Word-Order Variants

Different PLC manufacturers split 32-bit floats into register pairs using different byte and word ordering. There are four possible arrangements, and encountering all four in a single plant is common:

Variant 1: Big-Endian (AB CD) — "Network Order"

The most intuitive layout. The high word occupies the lower register address.

Register N  :  0x4291  (bytes A, B)
Register N+1: 0x0000 (bytes C, D)

Reconstruct: (Register_N << 16) | Register_N+10x42910000 → 72.5

Used by: Many Allen-Bradley/Rockwell PLCs, Schneider Modicon M340/M580, some Siemens devices.

Variant 2: Little-Endian Word Swap (CD AB)

The low word comes first. This is surprisingly common.

Register N  :  0x0000  (bytes C, D)
Register N+1: 0x4291 (bytes A, B)

Reconstruct: (Register_N+1 << 16) | Register_N0x42910000 → 72.5

Used by: Many Modbus TCP devices, Conch controls, various Asian-manufactured PLCs.

Variant 3: Byte-Swapped Big-Endian (BA DC)

Each 16-bit word has its bytes reversed, but word order is normal.

Register N  :  0x9142  (bytes B, A)
Register N+1: 0x0000 (bytes D, C)

This requires swapping bytes within each word before combining.

Used by: Some older Emerson/Fisher devices, certain Yokogawa controllers.

Variant 4: Byte-Swapped Little-Endian (DC BA)

The least intuitive: both word order and byte order are reversed.

Register N  :  0x0000  (bytes D, C)
Register N+1: 0x9142 (bytes B, A)

Used by: Rare, but you'll find it in some legacy Fuji and Honeywell equipment.

How Production IIoT Systems Handle This

In a real manufacturing environment, you don't get to choose which word order your equipment uses. A single plant might have:

  • TCU (Temperature Control Units) using Modbus RTU at 9600 baud, storing floats in registers 404000-404056 with big-endian word order
  • Portable chillers on Modbus TCP port 502, using 16-bit integers (no float encoding needed)
  • Batch blenders speaking EtherNet/IP natively, where float handling is built into the CIP protocol
  • Dryers with Modbus TCP and CD-AB word swapping

A well-designed edge gateway handles this with per-device configuration. The key insight: float decoding is a device-level property, not a global setting. Each equipment type gets its own configuration that specifies:

  1. Protocol (Modbus RTU, Modbus TCP, or EtherNet/IP)
  2. Register address (which pair of registers holds the float)
  3. Element count — set to 2 for a 32-bit float spanning two registers
  4. Data type — explicitly declared as float vs. int16 vs. uint32

Here's a generic configuration example for a temperature control unit reading float values over Modbus RTU:

{
"protocol": "modbus-rtu",
"tags": [
{
"name": "Delivery Temperature",
"register": 4002,
"type": "float",
"element_count": 2,
"poll_interval_sec": 60
},
{
"name": "Mold Temperature",
"register": 4004,
"type": "float",
"element_count": 2,
"poll_interval_sec": 60
},
{
"name": "Flow Rate",
"register": 4008,
"type": "float",
"element_count": 2,
"poll_interval_sec": 60
}
]
}

Notice the element_count: 2. This tells the gateway: "read two consecutive registers starting at this address, then combine them into a single 32-bit float." Getting this wrong is the most common source of incorrect readings.

The modbus_get_float() Trap

If you're using libmodbus (the most common C library for Modbus), you'll encounter modbus_get_float() and its variants:

  • modbus_get_float_abcd() — big-endian (most standard)
  • modbus_get_float_dcba() — fully reversed
  • modbus_get_float_badc() — byte-swapped, word-normal
  • modbus_get_float_cdab() — word-swapped, byte-normal

The default modbus_get_float() function uses CDAB ordering (word-swapped). This catches many engineers off guard — they read two registers, call modbus_get_float(), and get garbage because their PLC uses ABCD ordering.

Rule of thumb: Always test with a known value. Write 72.5 to a register pair in your PLC, read both registers as raw uint16 values, and observe which bytes are where. Then select the appropriate decode function.

Practical Decoding in C

Here's how you'd manually decode a float from two Modbus registers, handling the common big-endian case:

// Big-endian (ABCD): high word in register[0], low word in register[1]
float decode_float_be(uint16_t reg_high, uint16_t reg_low) {
uint32_t combined = ((uint32_t)reg_high << 16) | (uint32_t)reg_low;
float result;
memcpy(&result, &combined, sizeof(float));
return result;
}

// Word-swapped (CDAB): low word in register[0], high word in register[1]
float decode_float_ws(uint16_t reg_low, uint16_t reg_high) {
uint32_t combined = ((uint32_t)reg_high << 16) | (uint32_t)reg_low;
float result;
memcpy(&result, &combined, sizeof(float));
return result;
}

Never use pointer casting (*(float*)&combined). It violates strict aliasing rules and can produce incorrect results on optimizing compilers. Always use memcpy.

Element Count and Register Math

One subtle but critical detail: when you configure a tag to read a float, the element count tells the gateway how many 16-bit registers to request in a single Modbus transaction.

For a single float:

  • Element count = 2 (two 16-bit registers = 32 bits)
  • Read function code 3 (holding registers) or 4 (input registers)
  • The response contains 4 bytes of data

For an array of 8 floats (e.g., reading recipe values from a batch blender):

  • Element count = 16 (8 floats × 2 registers each)
  • Single Modbus read request for 16 consecutive registers
  • Far more efficient than 8 separate read requests

This is where contiguous register optimization matters. If you have tags at registers 4000, 4002, 4004, 4006, 4008 — all 2-element floats — a smart gateway combines them into a single Modbus read of 10 registers instead of 5 separate reads. This reduces bus traffic by 60-80% on RTU networks where every transaction costs 5-20ms of serial turnaround time.

Modbus RTU vs TCP: Float Handling Differences

RTU (Serial)

Serial Modbus has strict timing requirements. The inter-frame gap (3.5 character times of silence) separates messages. At 9600 baud with 8N1 encoding:

  • 1 character = 11 bits (start + 8 data + parity + stop)
  • 1 character time = 11/9600 = 1.146ms
  • 3.5 character silence = ~4ms

When reading float values over RTU, response timeout configuration matters. A typical setup:

Baud:             9600
Parity: None
Data bits: 8
Stop bits: 1
Byte timeout: 4ms (gap between consecutive bytes)
Response timeout: 100ms (total time to receive response)

If your byte timeout is too tight, the response may be split into two frames, and the second register of your float pair gets dropped. If you're seeing correct first-register values but garbage in the combined float, increase byte timeout to 5-8ms.

TCP (Ethernet)

Modbus TCP eliminates timing issues but introduces transaction ID management. Each request gets a transaction ID that the slave echoes back. For float reads, the process is identical — request 2 registers, get 4 bytes back — but the framing is handled by TCP, so there's no byte-timeout concern.

The default Modbus TCP port is 502. Some devices use non-standard ports; always verify with the equipment manual.

Common Pitfalls and Troubleshooting

1. Reading Zero Where You Expect a Float

Symptom: Register pair returns 0x0000 0x0000 → 0.0

Likely cause: Wrong register address. Remember the Modbus address convention:

  • Addresses 400001-465536 use function code 3 (read holding registers)
  • Addresses 300001-365536 use function code 4 (read input registers)
  • The actual register number = address - 400001 (for holding) or address - 300001 (for input)

A tag configured at address 404000 maps to holding register 4000 (function code 3). If you accidentally use function code 4, you're reading input register 4000 instead — a completely different value.

2. Reading Extreme Values

Symptom: You get values like 4.5e+28 or -3.2e-15

Likely cause: Wrong word order. You're combining registers in the wrong sequence. Try swapping the two registers and recomputing.

3. Getting NaN or Inf

Symptom: NaN (0x7FC00000) or Inf (0x7F800000)

Likely causes:

  • Word-order mismatch producing an exponent field of all 1s
  • Reading a register that doesn't actually contain a float (it's a raw integer)
  • Sensor disconnected — some PLCs write NaN to indicate a failed sensor

4. Values That Are Close But Off By a Factor

Symptom: You read 7250.0 instead of 72.5

Likely cause: The PLC stores values as scaled integers, not floats. Many older PLCs store temperature as an integer × 100 (so 72.5°F = 7250). Check the PLC documentation for scaling factors. This is especially common with Modbus devices that use single registers (element count = 1) for process values.

5. Intermittent Corrupt Readings

Symptom: 99% of readings are correct, but occasionally you get wild values.

Likely cause: On Modbus RTU, this is usually CRC errors that weren't caught, or electrical noise on the RS-485 bus. Add retry logic — read the registers, if the float value is outside physical bounds (e.g., temperature > 500°F for a plastics process), retry up to 3 times before logging an error.

Real-World Benchmarks

In production IIoT deployments monitoring plastics manufacturing equipment, typical float-read performance:

ProtocolFloat Read TimeRegisters per RequestEffective Throughput
Modbus RTU @ 960015-25ms2 (single float)~40 floats/sec
Modbus RTU @ 960030-45ms50 (contiguous block)~1,000 values/sec
Modbus TCP2-5ms2 (single float)~200 floats/sec
Modbus TCP3-8ms125 (max block)~15,000 values/sec
EtherNet/IP1-3msN/A (native types)~5,000+ tags/sec

The lesson: Modbus RTU float reads are slow individually but scale well with contiguous reads. If you have 30 float tags spread across non-contiguous addresses, it's 30 × 20ms = 600ms per polling cycle. Group your tags by contiguous address blocks to minimize transactions.

Best Practices for Production Systems

  1. Declare types explicitly in configuration. Never auto-detect float vs. integer — always specify the data type per tag.

  2. Use element count = 2 for floats. This is the most common source of misconfiguration. A float is 2 registers, always.

  3. Test with known values during commissioning. Before going live, write a known float (like 123.456) to the PLC and verify the IIoT platform reads it correctly.

  4. Document word order per device type. Build a device-specific configuration library. A TrueTemp TCU uses ABCD, a GP Chiller uses raw int16 — capture this per equipment model.

  5. Implement bounds checking. If a temperature reading suddenly shows 10,000°F, that's not a process event — it's a decode error. Log it, don't alert on it.

  6. Add retry logic for RTU reads. Serial networks are noisy. Retry failed reads up to 3 times before reporting an error status.

  7. Batch contiguous registers. Instead of reading registers 4000-4001, then 4002-4003, then 4004-4005 as three separate transactions, read 4000-4005 as a single 6-register request.

How machineCDN Handles Float Encoding

machineCDN's edge gateway is built to handle the float encoding problem across heterogeneous equipment fleets. Each device type gets a configuration profile that explicitly declares register addresses, data types, element counts, and polling intervals — eliminating the guesswork that causes most float decoding failures.

The platform supports Modbus RTU, Modbus TCP, and EtherNet/IP natively, with automatic protocol detection during initial device discovery. When a new PLC is connected, the gateway attempts EtherNet/IP first (reading the device type tag directly), then falls back to Modbus TCP on port 502. This dual-protocol detection means a single gateway can service mixed equipment floors without manual protocol configuration.

For plastics manufacturers running TCUs, chillers, blenders, dryers, and conveying systems, machineCDN provides pre-built device profiles that include correct register maps, data types, and word-order settings — so the float encoding problem is solved before commissioning begins.


Getting float encoding right is the foundation of trustworthy IIoT data. Every OEE calculation, every alarm threshold, every predictive maintenance model depends on correct readings from the plant floor. Invest the time to verify your decoding — the downstream value is enormous.

MQTT Last Will and Testament for Industrial Device Health Monitoring [2026]

· 12 min read

MQTT Last Will and Testament for Industrial Device Health

In industrial environments, knowing that a device is offline is just as important as knowing what it reports when it's online. A temperature sensor that silently stops publishing doesn't trigger alarms — it creates a blind spot. And in manufacturing, blind spots kill uptime.

MQTT's Last Will and Testament (LWT) mechanism solves this problem at the protocol level. When properly implemented alongside birth certificates, status heartbeats, and connection watchdogs, LWT transforms MQTT from a simple pub/sub pipe into a self-diagnosing industrial nervous system.

This guide covers the practical engineering behind LWT in industrial deployments — not just the theory, but the real-world patterns that survive noisy factory networks.